Trace View
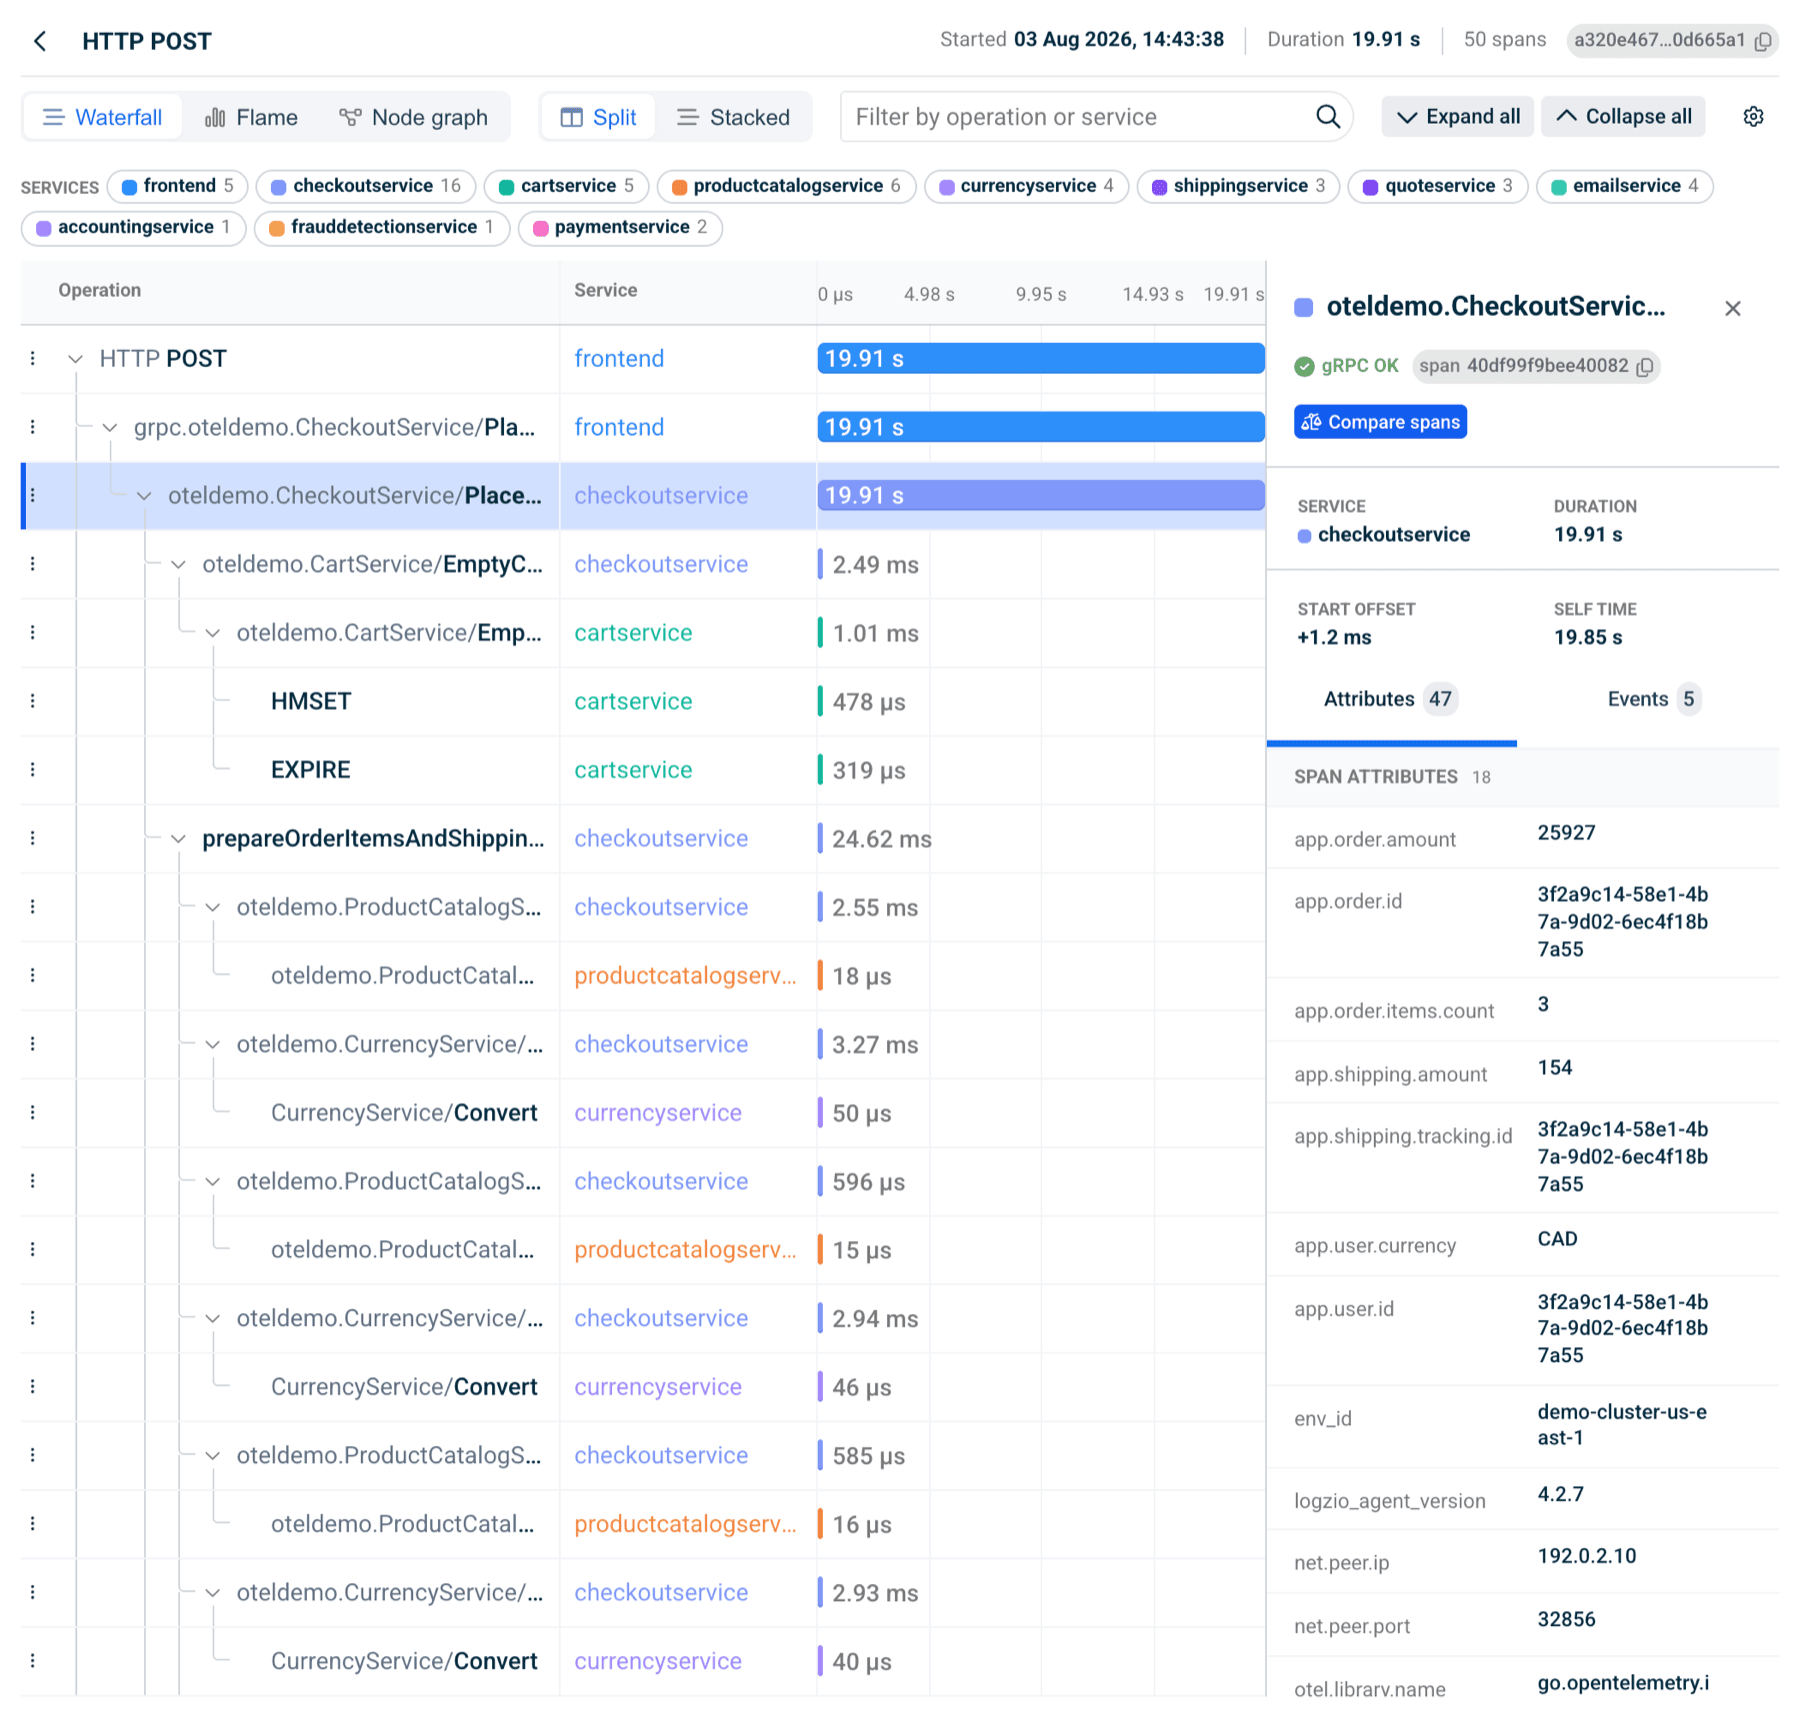
Trace View shows a single distributed trace: every span, how they nest, how long each took, and where the time actually went. It's where you land once you've found something worth explaining - a slow request, a failed operation, a log line you want the surrounding story for.
The same view is used everywhere a trace opens, so the controls below behave identically no matter how you got there.
Open a trace
| From | How |
|---|---|
| A log | Expand a log entry in Explore and select the Trace tab. Requires log-to-trace correlation - see Correlate logs and traces. |
| A span | Select any row in the Traces tab of Explore. |
| A service | Open a service or operation in APM and drill into a trace. |
Choose a visualization
The toolbar's view switcher offers three ways to read the same trace. Switching views keeps the trace and your filter - only the shape changes.

Waterfall - the default. One row per span, nested by parent, with a duration bar on a shared timeline. Best for reading sequence and spotting the gap where time disappeared.
Flame - spans stacked by depth, width proportional to duration. Best for seeing which subtree dominates total time, especially in a trace too deep to scan row by row.
Node graph - services and calls as a graph. Best for understanding the call topology and finding a fan-out or an unexpected dependency. Filtering here is done by selecting nodes rather than typing, so the toolbar's text filter is hidden in this view.
Work the waterfall

Layout - Split puts Operation and Service in their own columns beside the timeline. Stacked drops the columns and puts each span's duration bar directly under its operation name, which reads better on narrow screens and deep traces.
Filter by operation or service - type to narrow the rows to matching spans.
Expand all / Collapse all - open or close the whole span hierarchy at once. Individual rows expand and collapse on their own too, and connecting lines show which spans are children of which.
Columns (gear icon, Split layout only) - choose which attribute columns appear alongside the timeline, and drag to reorder them. The list is built from the attribute keys actually present in this trace plus service, so it never offers a column your data can't fill.
Service legend - the color assigned to each service in this trace. The same colors are used in the span details panel and in the span results table, so a service keeps one color across the whole investigation.
Read the span details panel
Select any span to open its details.
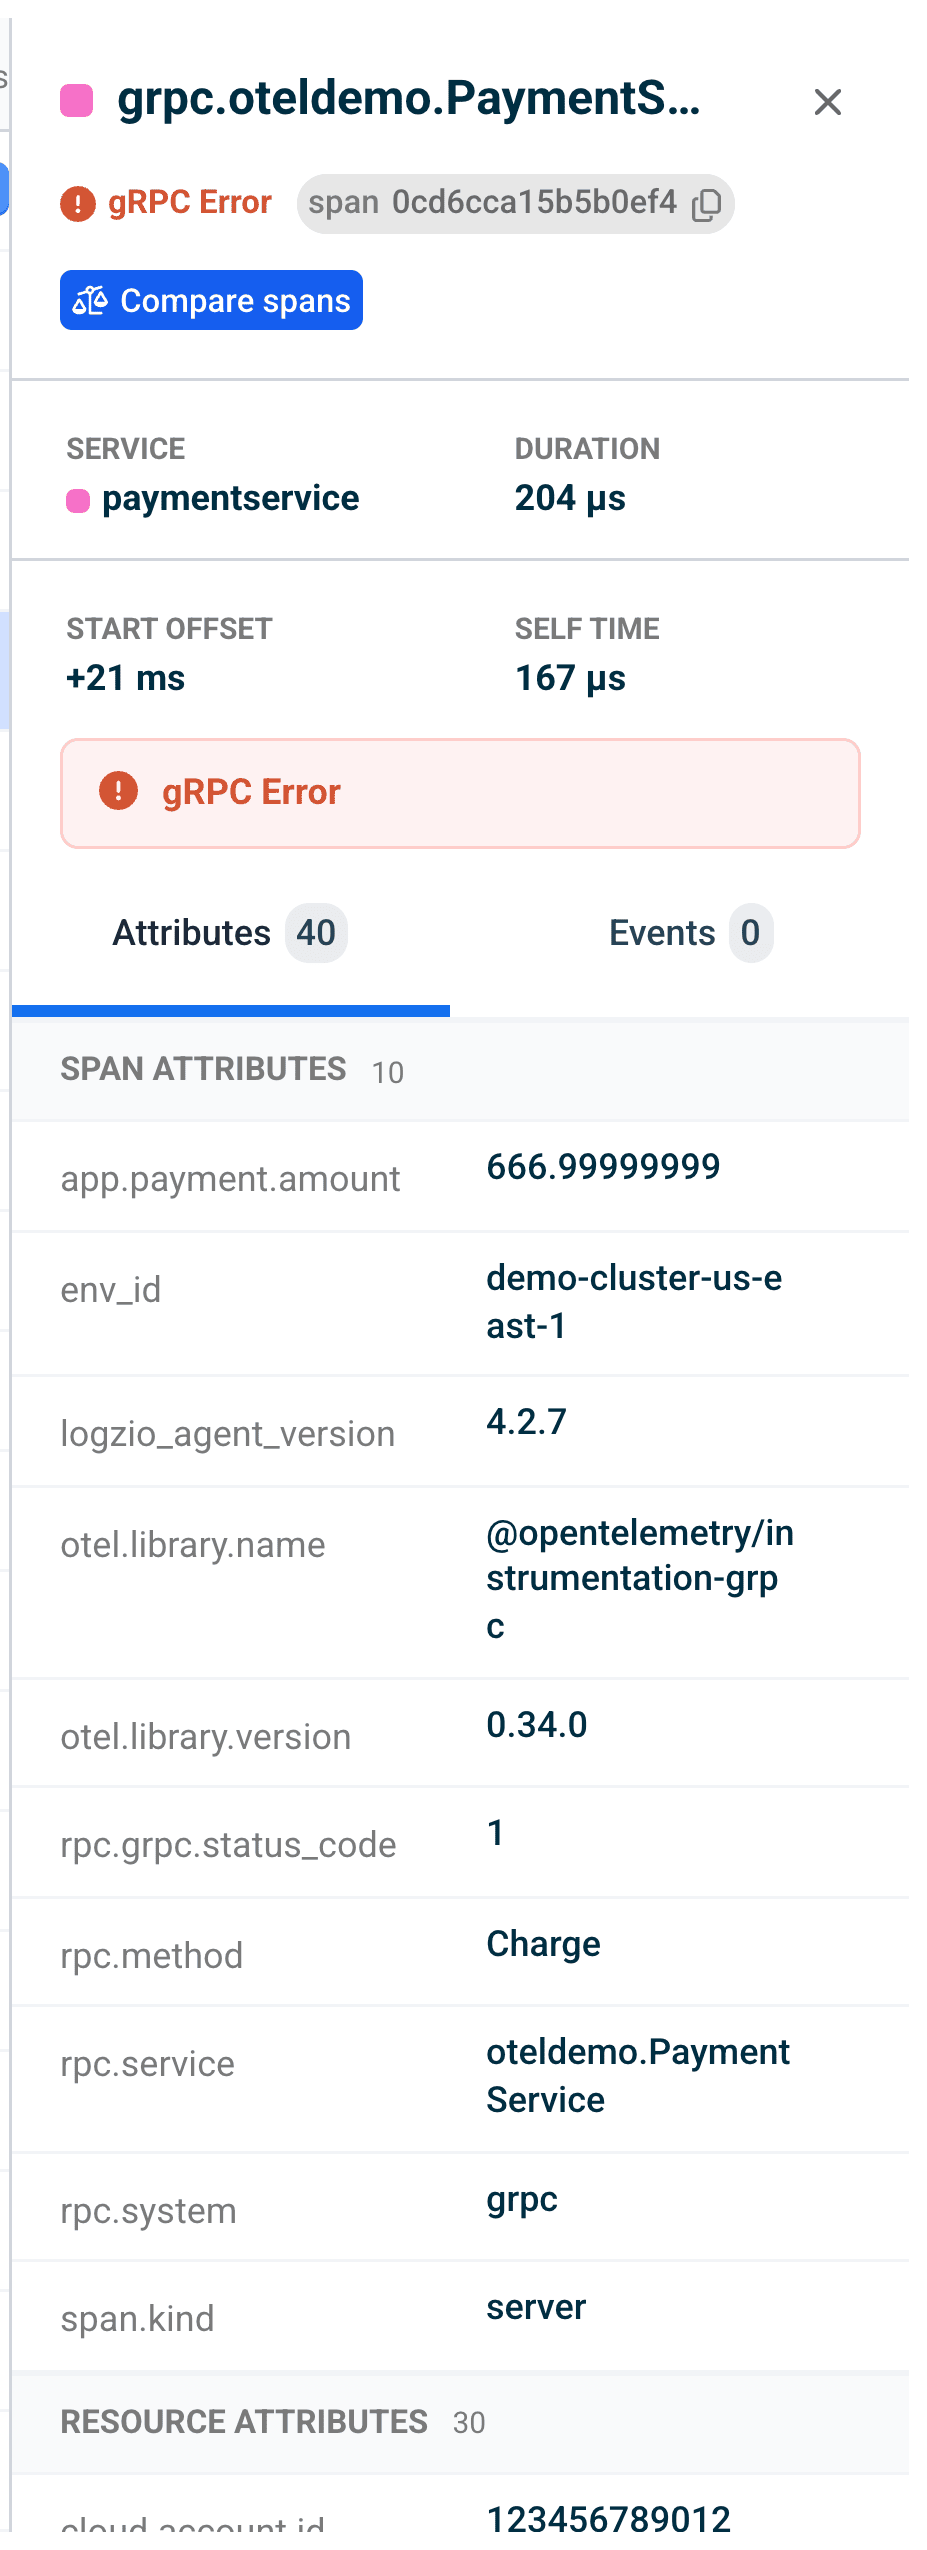
The header carries the operation name, the span's status, and the span ID with a copy control. Two actions may appear:
- Operation overview - jumps to that operation's APM metrics.
- Compare spans - opens Compare Spans pre-scoped to this service and operation. The split is chosen for you from the span you selected: an errored span opens Failed vs OK, anything else opens Slow vs Fast.
Below the header, four numbers summarize the span:
| Field | Meaning |
|---|---|
| Service | The service that emitted the span. |
| Duration | Total wall-clock time for the span. |
| Start offset | How far into the trace the span started. |
| Self time | Time spent in this span excluding its children - the figure that tells you whether the span itself was slow or was just waiting on something it called. |
When the span failed, a red banner above the tabs shows the exception message pulled from the span's exception event, falling back to the status label when the exception carries no message.
Attributes tab
Attributes are split into Span attributes (set on the span itself) and Resource attributes (set on the emitting service or host), each with a count. Select the pin control on any attribute to Add as table column in the waterfall, or Remove from table columns if it's already there - so an attribute you find interesting on one span becomes visible on every span at once.
Events tab
Span events with their timestamps and fields, including exceptions and stack traces where your instrumentation emits them. The tab label shows the event count, so you can tell whether a span has events without opening it.
Correlate logs and traces
To open a trace from a log, logs and traces must share a trace ID.
Requirements:
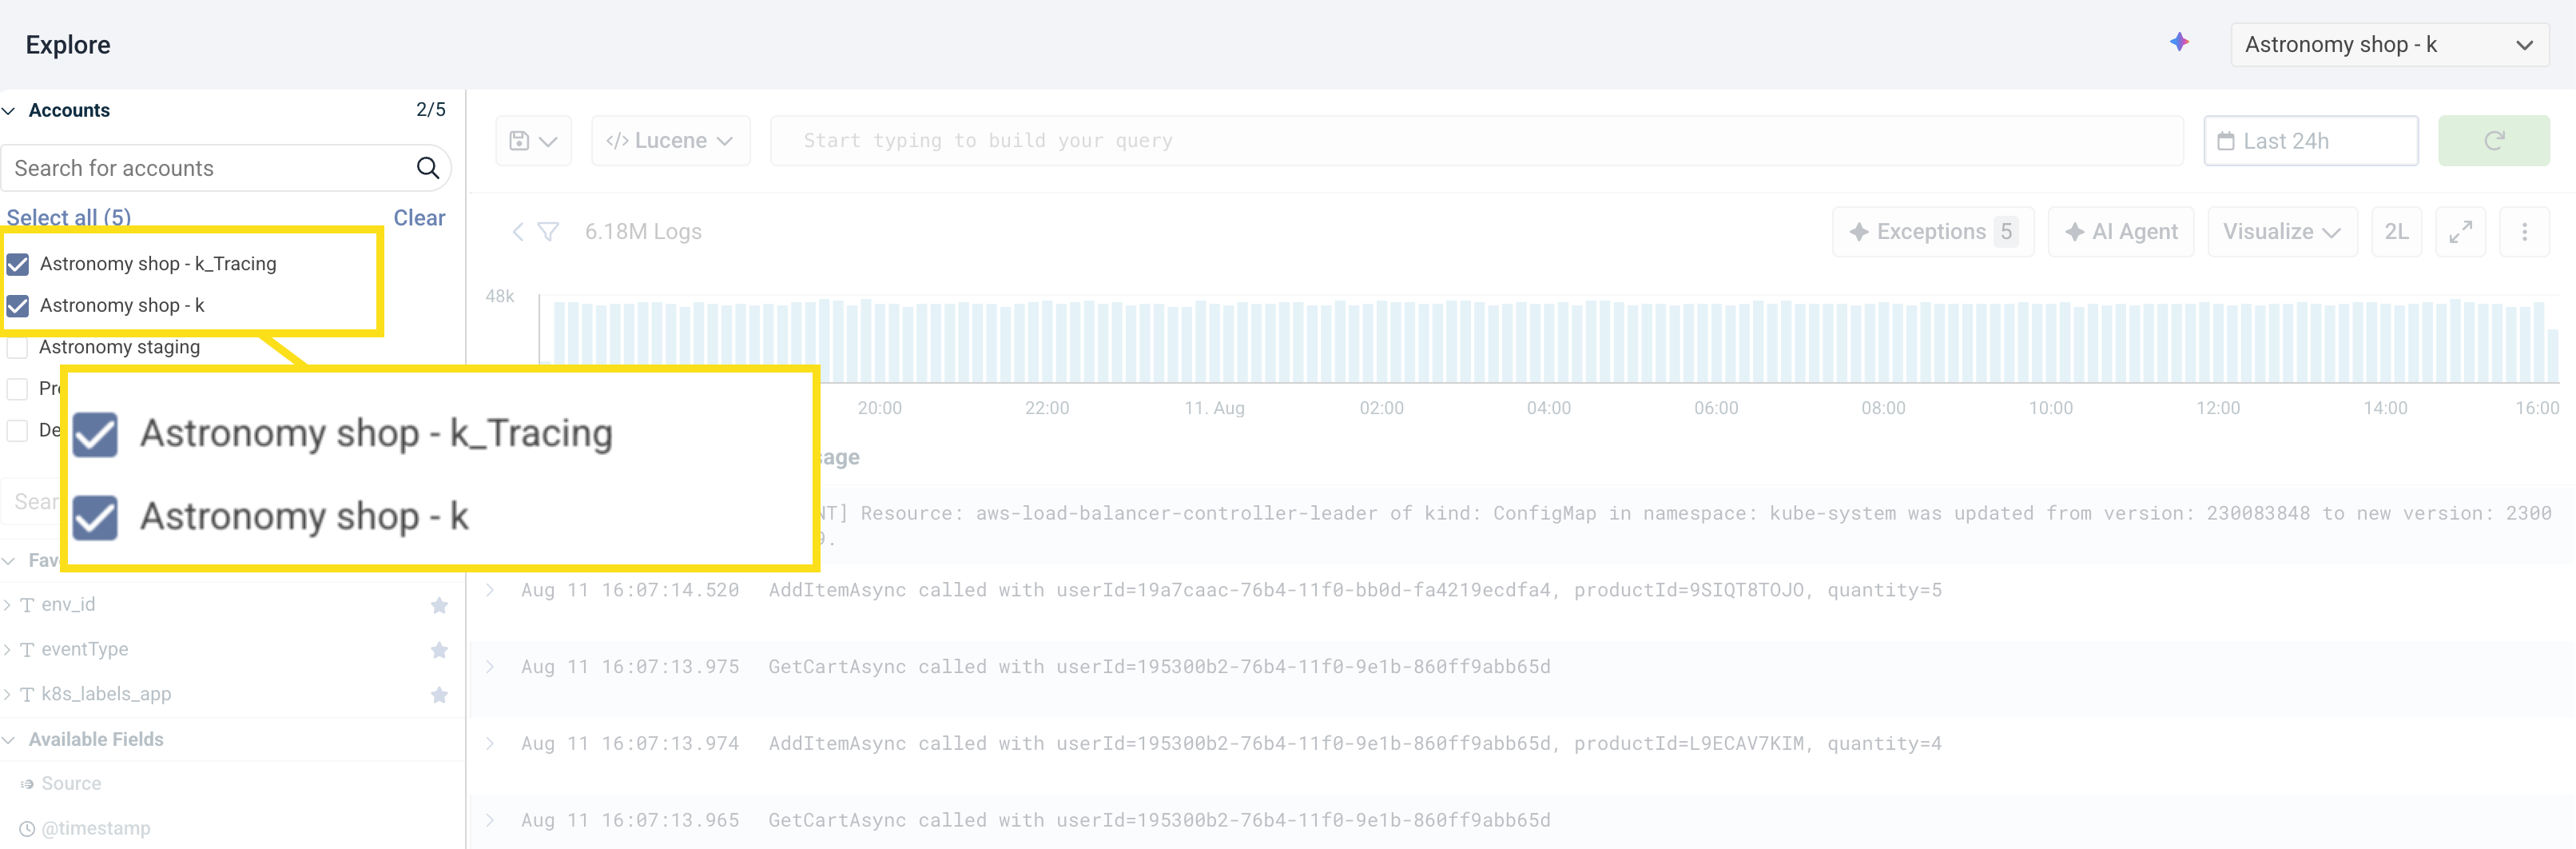
- An active Logz.io Tracing account.
- A
traceIDortrace_idvalue on both the traces and the logs correlated with those traces. Most OpenTelemetry-compliant libraries handle this automatically through trace context. Use Logz.io's collector to send traces and Logz.io's SDKs to send trace-context-propagated logs.
The field must hold the same value in both logs and traces. Once configured, expand a log entry in Explore and confirm the Trace tab shows the associated trace.
Logz.io Tracing accounts retain data for 10 days, so logs older than that may no longer resolve to a trace.
Supported integrations for trace context:
Additional integrations will be available in future updates.
Best practices and troubleshooting
- Maintain consistent trace IDs - make sure
trace_idis propagated across all services so logs and traces correlate. - Check your account selection - the accounts selected in Explore must include trace data.
- Read self time before duration - a long duration with a short self time means the span was waiting, not working. Follow its children instead.
- Optimize sampling and filters - adjust sampling limits or increase the sample size if traces are too sparse to be useful.
- Verify instrumentation - confirm your application and tracing libraries are instrumented correctly.
- Include trace context - confirm
traceIDortrace_idis present and consistent in both logs and traces. - Reconnect and resend - if traces still don't appear, resend trace data to Logz.io.
- Validate regularly - periodically confirm logs and traces are still linked.
For further assistance, contact our support team.