Span Search in Explore
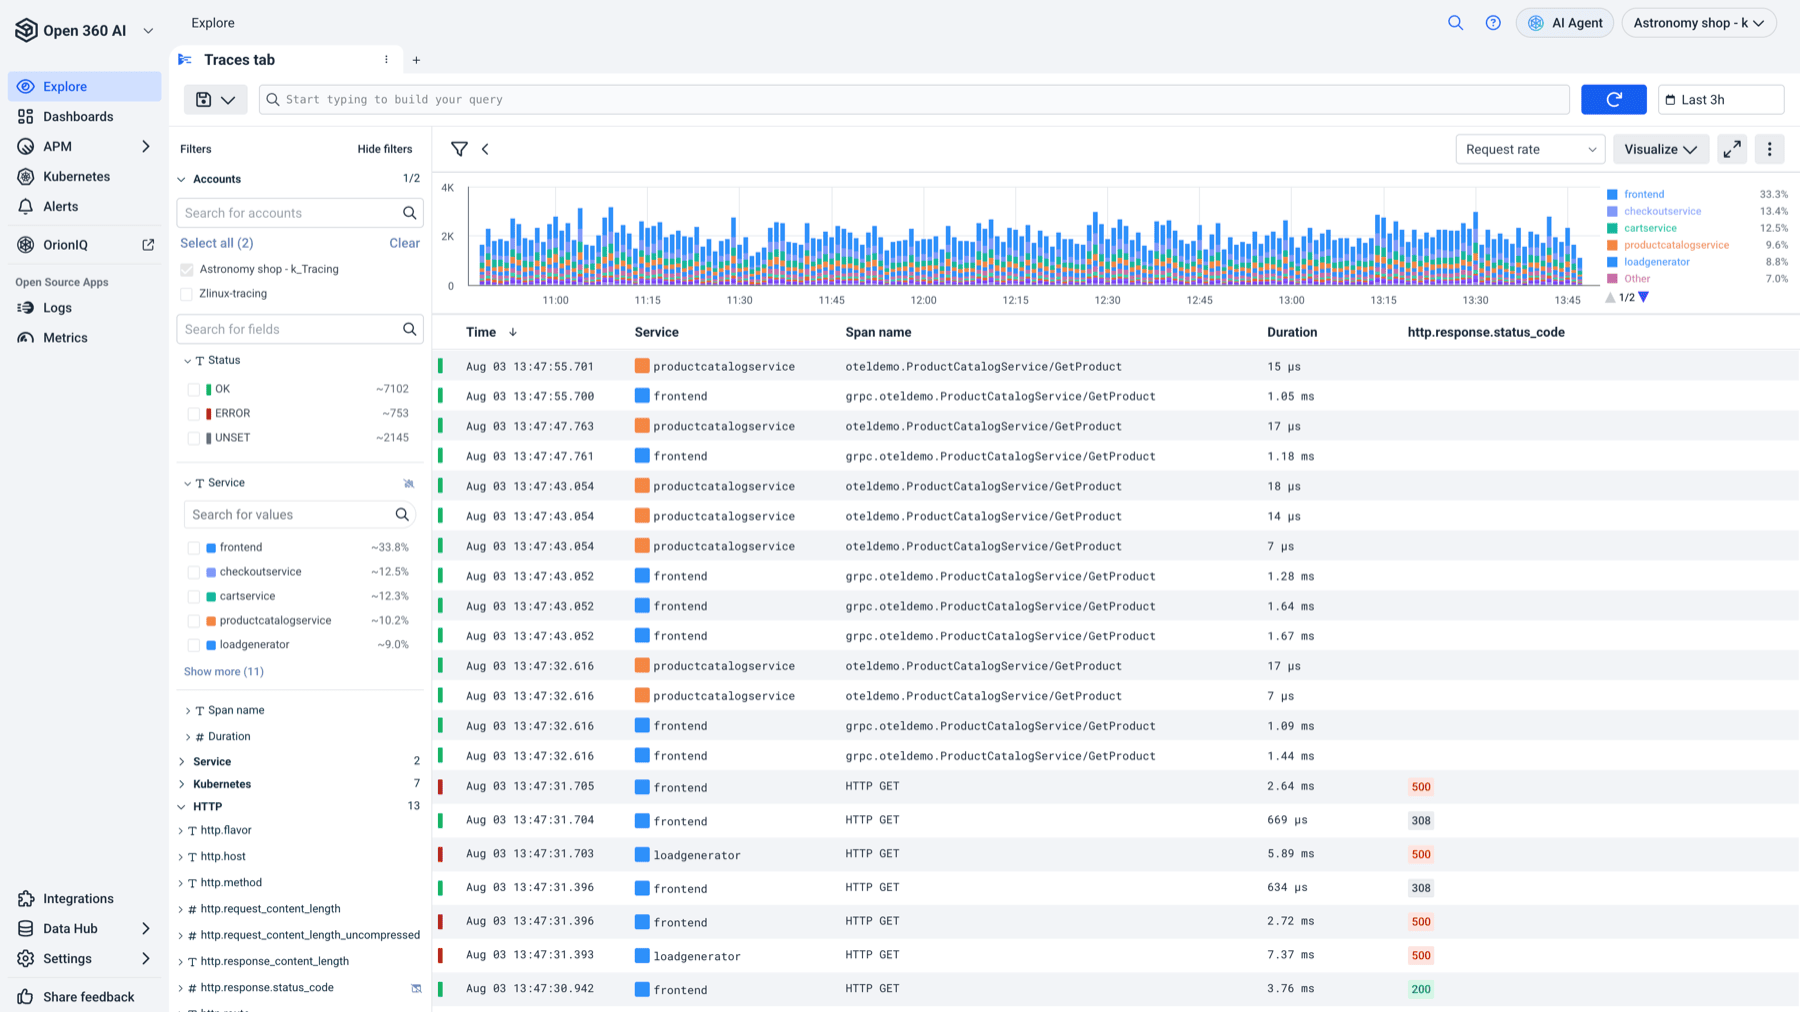
The Traces tab in Explore searches your tracing data at the span level. Instead of starting from a service or a trace ID, you query spans directly - the same way you query logs - then jump into the full trace once you've found the span that matters.
Use it to answer questions like which spans failed in the last hour, which database calls got slower after the deploy, or what does the p99 look like broken down by Kubernetes namespace.
Prerequisites
- At least one tracing account. The account selector only lists accounts of type Tracing, and the Traces tab is disabled with the tooltip Traces explore is not available for this account when none exist.
- Traces shipped to Logz.io. See Send your traces if you haven't set up tracing yet.
Open the Traces tab
In Explore, select the Traces tab. Explore tabs are independent - each keeps its own query, filters, timeframe, and table columns - so you can keep a logs investigation open in one tab while you dig into spans in another. Double-click a tab to rename it.
Search spans
The search bar uses the same enhanced Lucene editor as log search, with autocomplete and syntax highlighting over span fields:
service.name:"checkout-api" AND otel.status_code:ERROR
Above the search bar you set:
- Accounts - which tracing accounts to search. Defaults to your most recently used tracing account.
- Timeframe - the time range for both the chart and the table.
Select Search to run the query.
Overview chart
The chart above the results plots one metric over the selected timeframe, broken out by a group-by field.
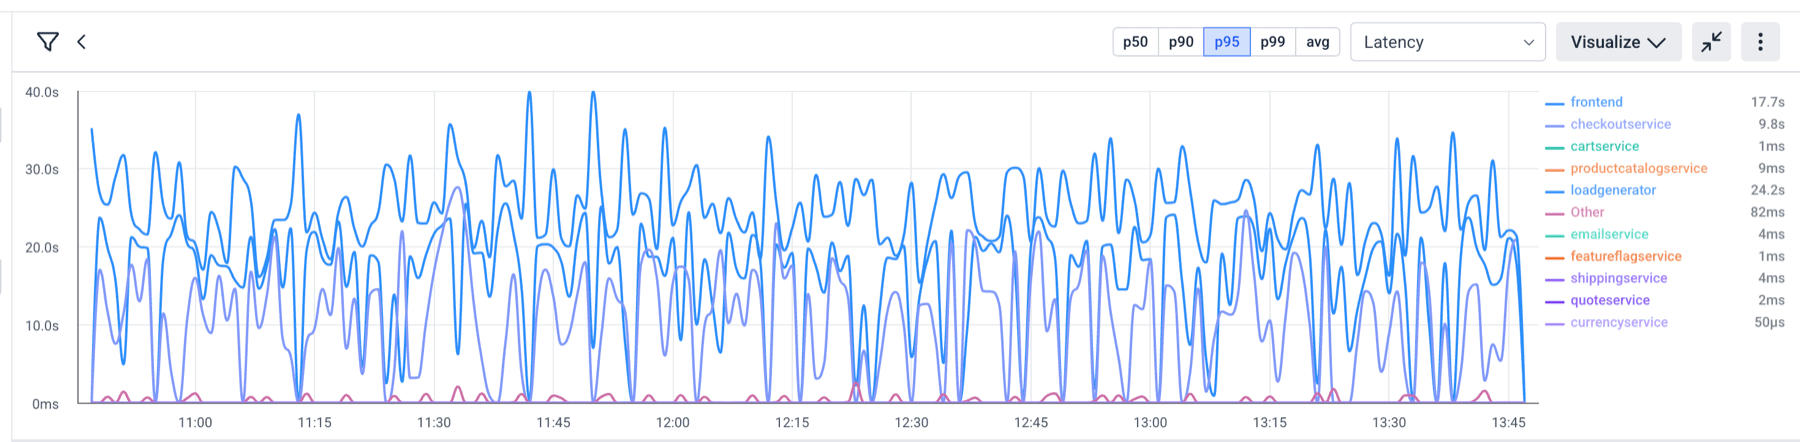
| Control | Options | Default |
|---|---|---|
| Metric | Request rate or Latency | Request rate |
| Percentile | p50 p90 p95 p99 avg - only shown when the metric is Latency | avg |
| Group by | Any span field | service.name |
| Time interval | Bucket size for the series | Auto |
Select the expand control to grow the chart from its compact height to full height when you need to read a series closely. Hover any point for a tooltip with per-series values; latency values are formatted as durations, request rate as counts.
The chart and the table always reflect the same query and filters, so narrowing the search narrows both.
Filter pane
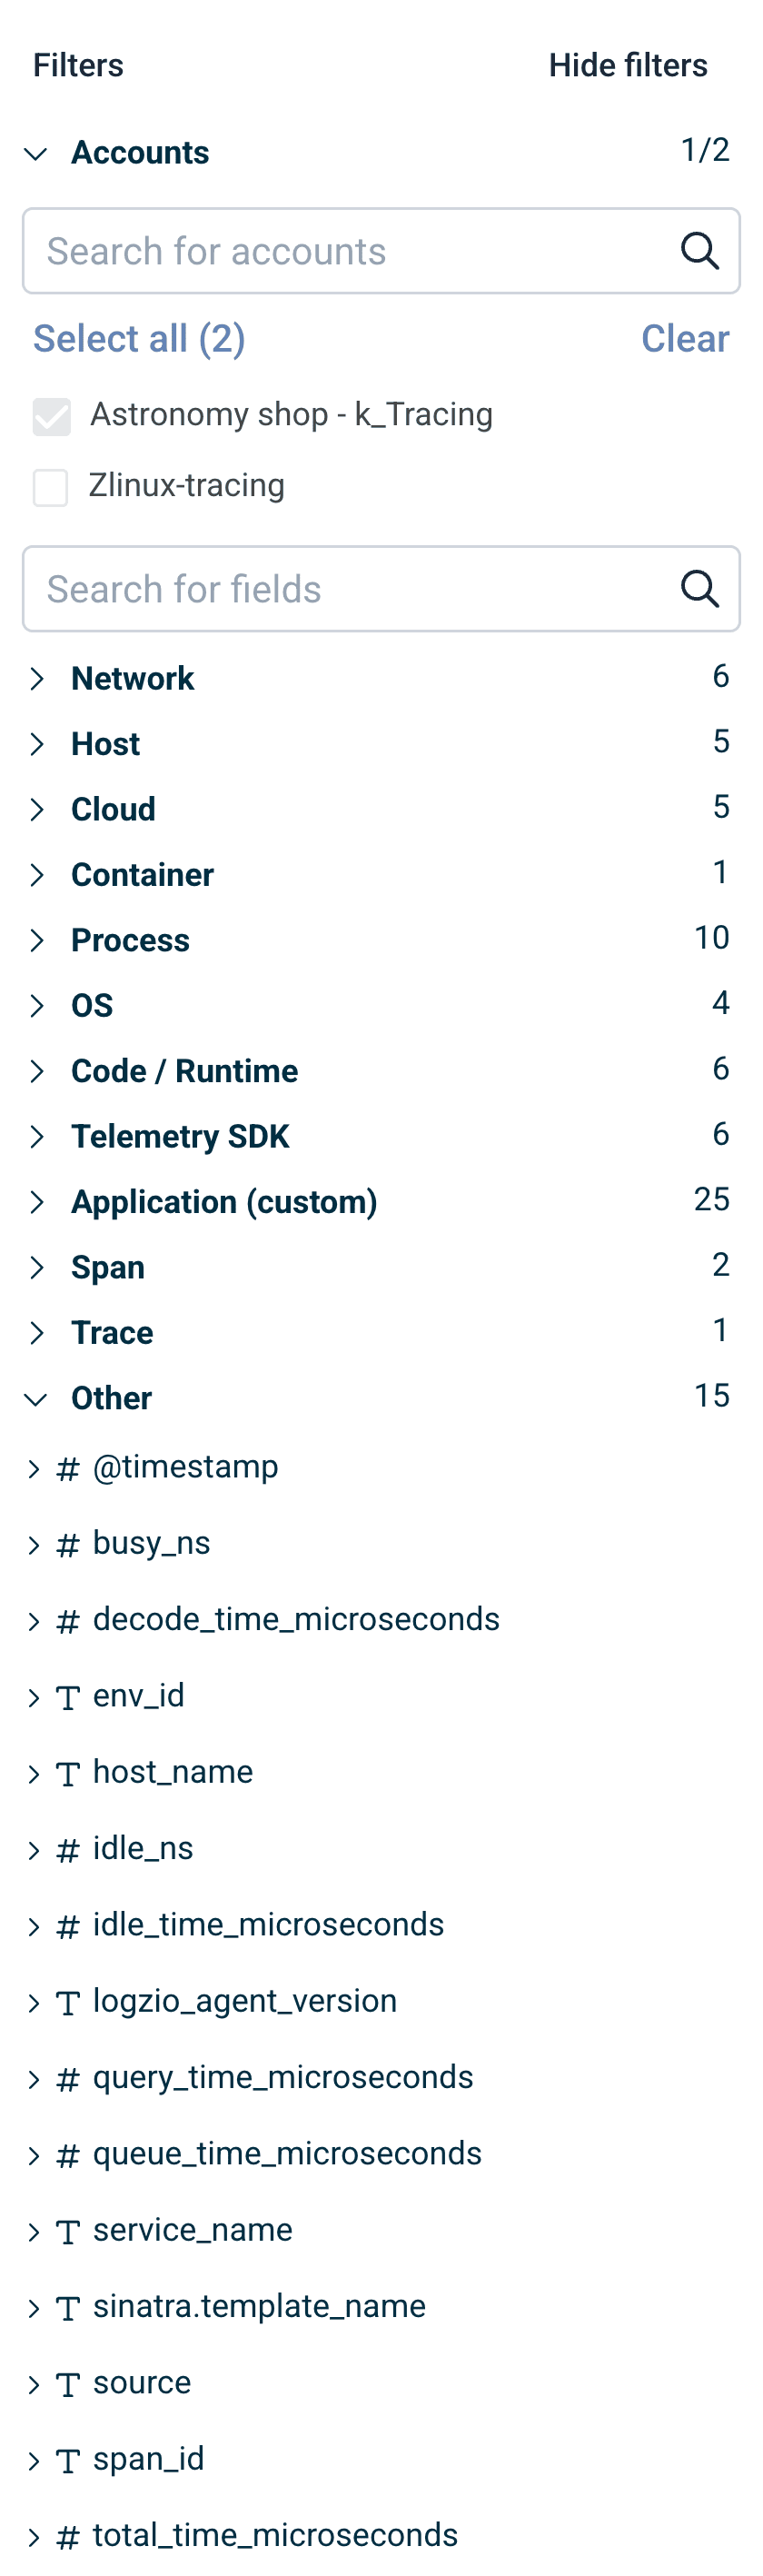
The filter pane on the left lists the span attributes present in your data, grouped by OpenTelemetry semantic-convention namespace rather than as one flat list. Categories render in a fixed order, and any category that is empty for your data is hidden:
Service · Kubernetes · HTTP · Database · RPC · Messaging · Network · Host · Cloud · Container · Process · OS · Code / Runtime · Telemetry SDK · Deployment · URL · GenAI / LLM · Application (custom) · Span · Trace · Other
Anything that doesn't match a known namespace prefix falls into Other. Categories holding a field that is currently a table column open by default, so the fields you're already working with are visible without hunting.
Filter on a field
Select a field to see its values, then check the ones you want. Each value can be included or excluded, so filters resolve to either is or is not. String fields also accept a value you type in yourself, which is useful for a value that's real but too rare to appear in the suggested list.
Numeric fields render as a range instead of a checklist. Duration values are in milliseconds.
Field actions
Hover a field in the pane for two shortcuts:
- Add to table / Remove from table - toggles the field as a results-table column.
- Group in graph / Remove from graph - sets the overview chart's group-by to that field.
Both actions show their current state at rest, so you can tell at a glance which fields are already in the table or driving the chart. The four core columns don't offer Remove from table - see below.
Results table
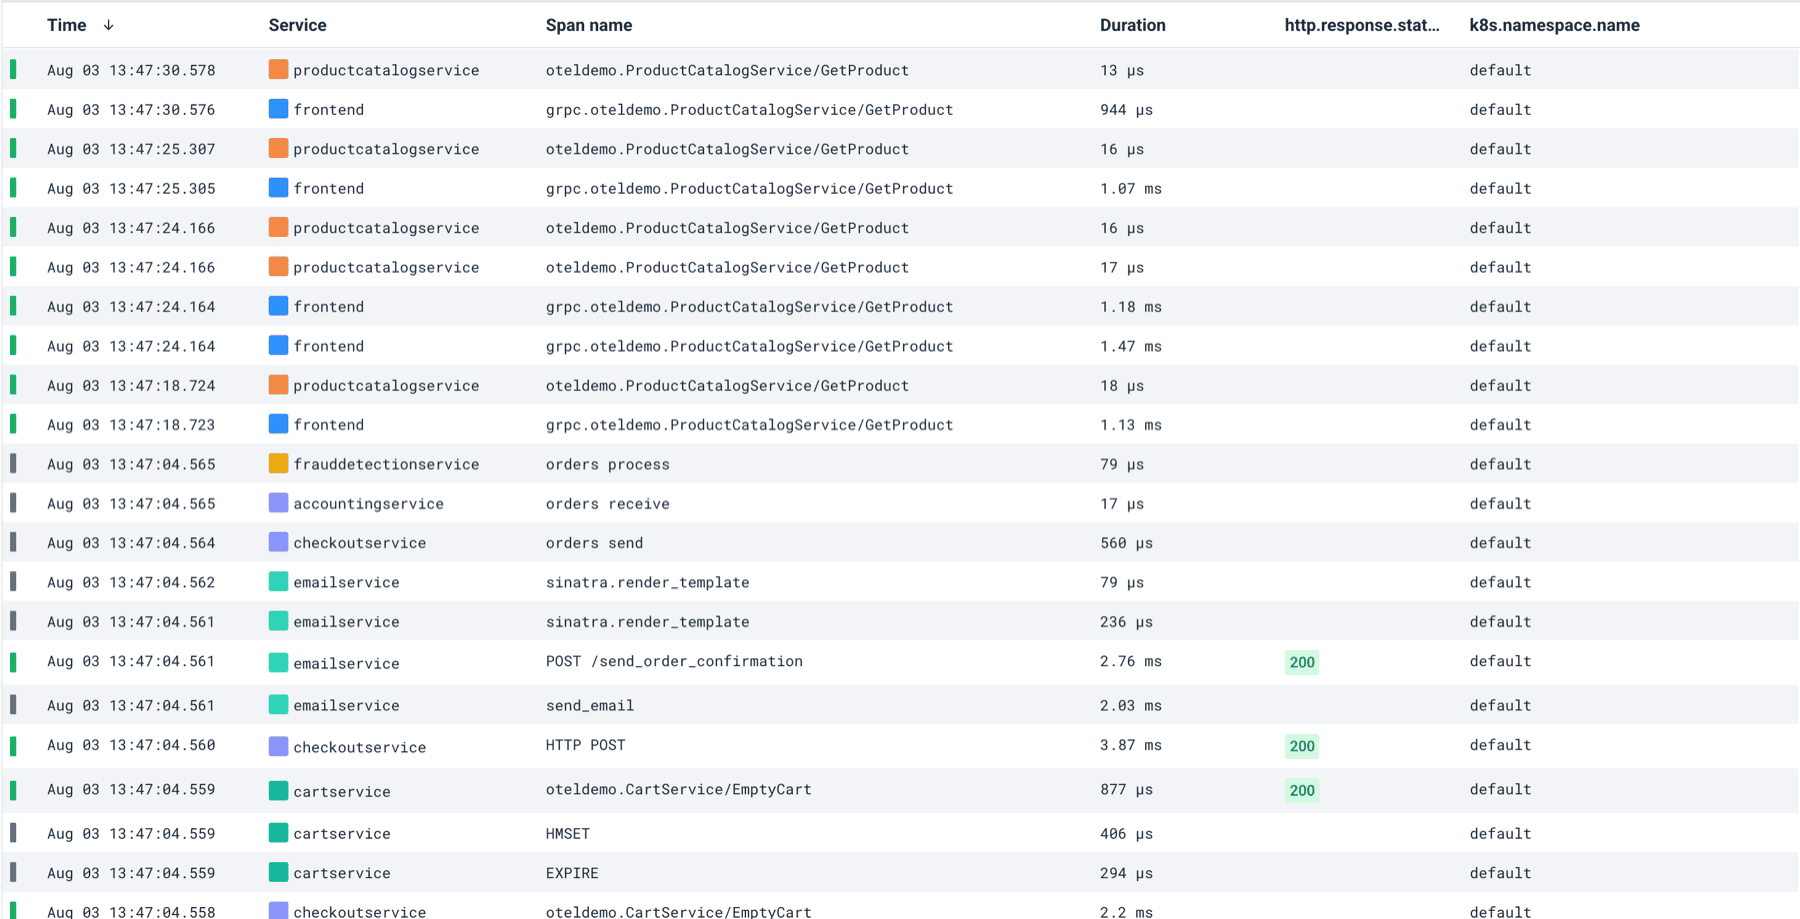
Default columns:
| Column | Field | Sortable |
|---|---|---|
| Time | @timestamp | Yes |
| Service | service.name | No |
| Span name | span.name | No |
| Duration | span.duration | Yes |
http.response.status_code | http.response.status_code | No |
Results are sorted newest-first (Time descending) by default.
Time, Service, Span name, and Duration are permanent - they can't be removed, because they're the minimum needed to make a row readable. Any other column, including http.response.status_code and anything you add from the filter pane, can be removed from the column header menu. If you remove the column the table is sorted by, sorting falls back to newest-first.
A colored indicator on each row reflects the span's otel.status_code (OK, ERROR, UNSET), so failures are visible while scrolling. Service names are color-coded consistently between the table and the trace drawer.
Select any row to open its full trace. See Trace View for the waterfall, flame, and node-graph views.
Limits
- 100 spans per page, loaded as you scroll.
- 10,000 spans maximum per result set. Narrow the timeframe or add filters to get under the cap.
Save a search
Save a span search to reuse the query, filters, columns, and chart settings later. Saved span searches work the same way as saved log searches - see Saved Search.
Compare two groups of spans
When you want to know what is different about the slow or failing spans rather than just list them, use Compare Spans. It splits a set of spans into two cohorts and reports which attributes differ between them. See Compare Spans.