Log Patterns
Most log volume is a small number of messages repeated a great many times. Patterns collapses similar messages into a single row, so instead of scrolling thousands of near-identical lines you see the handful of shapes they take — and how much of your account each one accounts for.
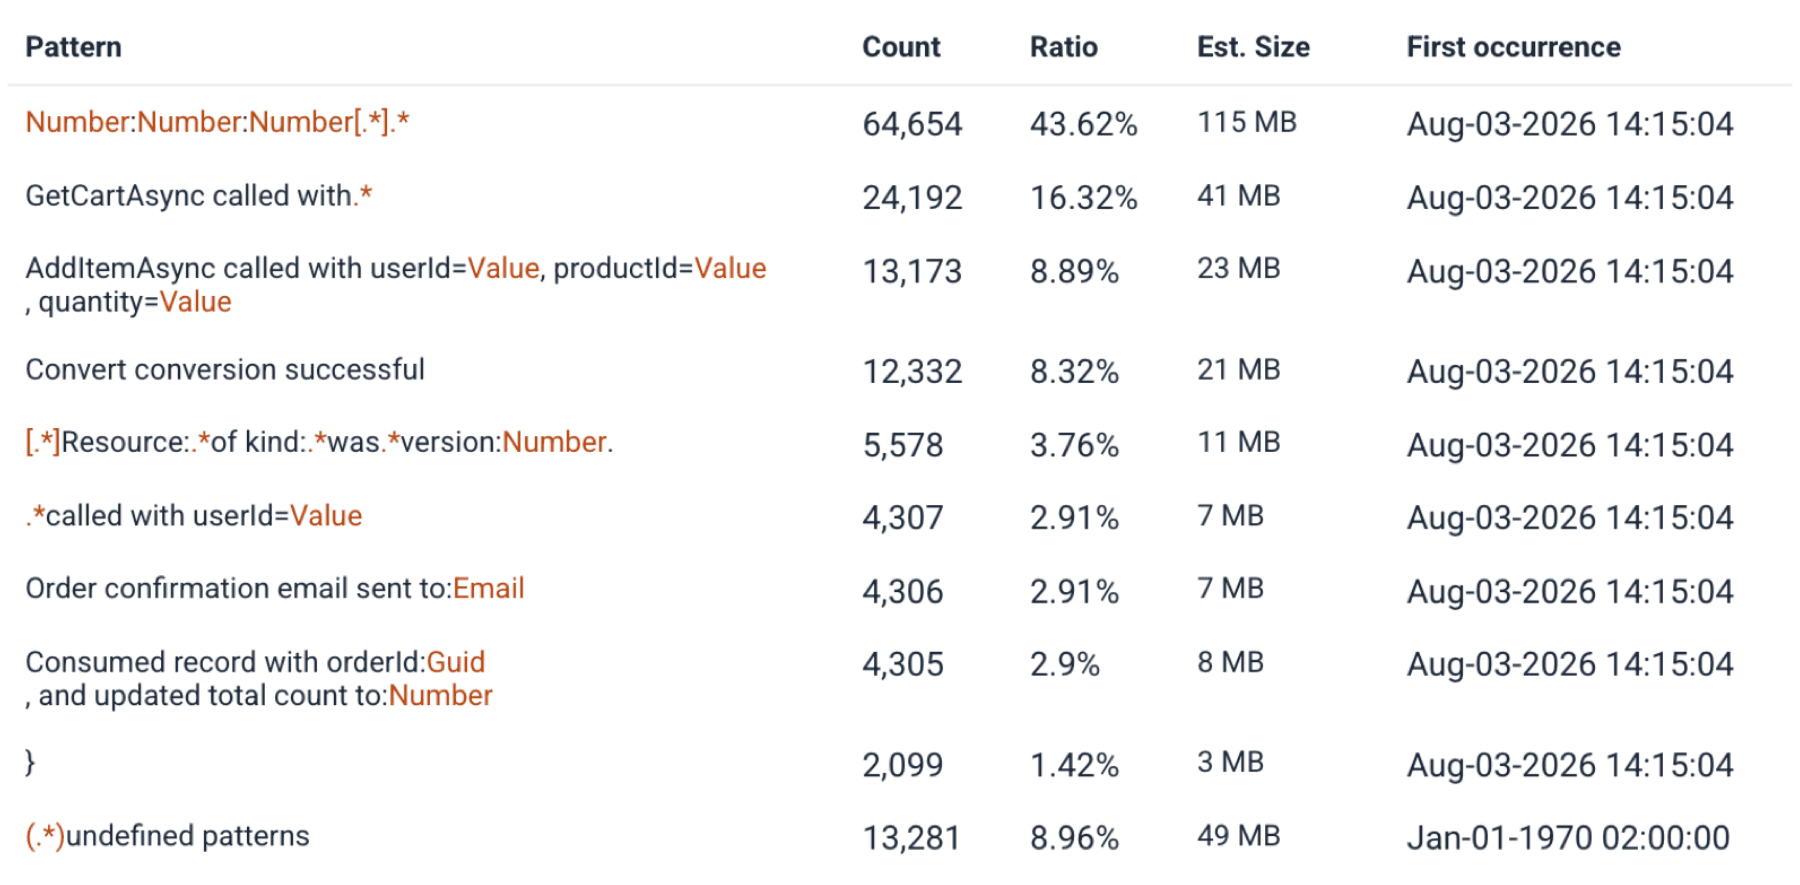
Two things it's good for: finding the noise worth dropping, and finding the signal you didn't know was frequent.
Open patterns
In Explore, open the quick view and select Patterns. Patterns are computed over your current query, accounts, and timeframe — so narrowing the search narrows the patterns, and you can ask "what's noisy in this service" rather than only "what's noisy overall".
Read the table
| Column | What it tells you |
|---|---|
| Pattern | The message shape, with the variable parts abstracted out. |
| Count | How many logs matched it in the timeframe. |
| Ratio | That count as a percentage of the logs in scope — the fastest way to see what dominates. |
| Est. Size | Estimated storage the pattern accounts for. This is the column that turns a noise problem into a cost conversation. |
| First occurrence | When the pattern first appeared in the timeframe. Useful for spotting something that started rather than something that's always been there. |
Sort by Most frequent to find volume, or Most recent to find what's new.
What to do with a pattern
Once you know what's flooding the account, you have three routes:
- It's genuinely useless — add a drop filter so it stops being indexed at all.
- You need the trend, not the lines — convert it with Logs to Metrics, keeping the signal at a fraction of the volume.
- It's a real problem — filter Explore to that pattern and investigate it as logs.
A pattern that appeared for the first time an hour ago and already accounts for a large share of volume is usually worth reading before it's worth dropping.
Related
- Intro to Explore
- Exceptions — the same idea, narrowed to errors
- Data optimization