Drilldowns
A dashboard tells you something changed. A drilldown is how you find out why without starting a new search from scratch.
Configure a panel with drilldowns and clicking into it opens the logs, traces, or dashboard that explains it — already scoped to the series you clicked and the time range you were looking at.
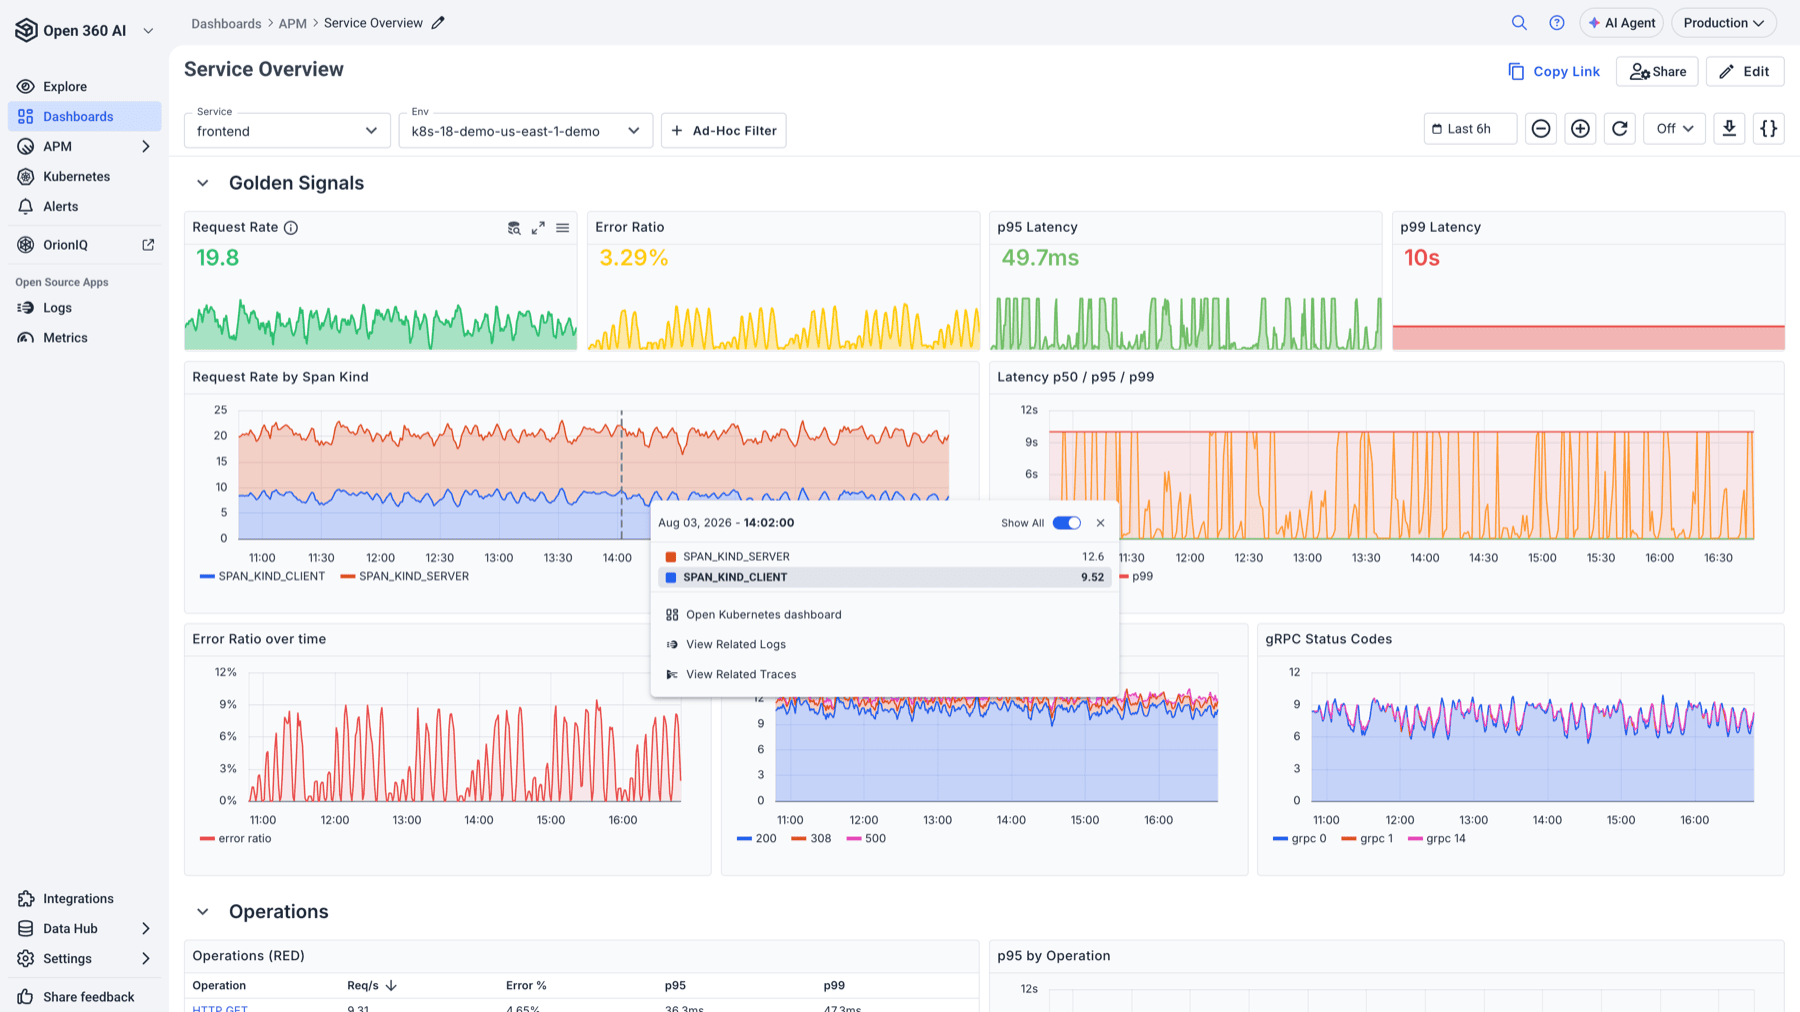
Selecting a point on a chart pins its tooltip and offers the drilldowns configured for that panel — here a target dashboard alongside related logs and traces.
What a drilldown can open
| Target | What you get |
|---|---|
| Related logs | The logs matching the clicked series, in a drawer with a graph, a results table, and an editable query. |
| Related traces | The matching spans, and from there the full trace waterfall. |
| Another dashboard | A target dashboard opened with its variables filled in from what you clicked. |
Logs and traces drawers include a View in Explore action, so if the drawer isn't enough you can continue in Explore with the query intact rather than rebuilding it.
Because the drawer's query is editable, the drilldown is a starting point rather than a fixed result — widen it, drop a clause, and keep going without leaving the dashboard.
Set up logs or traces drilldowns
Open the panel editor and use its data-links settings to enable View Related Logs or View Related Traces, then choose the datasources to search.
When you drill from a metrics panel into logs, the panel's PromQL label matchers are translated into an equivalent Lucene query, so the log search is scoped by the same labels you were charting. A metric grouped by service drills into that service's logs, not everything.
Select all the accounts the data could be in, not just the obvious one. Services and environments often span accounts, and a single-account drilldown quietly returns nothing rather than telling you it looked in the wrong place.
Set up a dashboard drilldown
For each dashboard drilldown, set:
- Target dashboard — where the drilldown goes.
- Menu label — what the reader sees. Left empty, a label is derived from the target dashboard's name.
- Open behaviour — Drawer to stay in place, or New tab to keep both views.
Then map the target dashboard's variables. Each variable can take its value from:
| Source | Behaviour |
|---|---|
| From clicked point | Uses the dimension of the series you clicked, such as the pod or service name. This is what makes a drilldown feel contextual. |
| From source variable | Copies the value of a variable on the current dashboard, so environment and cluster carry across. |
| Static value | A fixed value you type. Supports $variable tokens, which are interpolated when the drilldown runs. |
| Target default | Leaves the target dashboard's own default in place. |
For account variables you can also select All accounts, which is the safer choice when you don't know where the data lives.
A drilldown carries the time range you were looking at, so the target opens on the same window rather than its own default.
How readers trigger it
Drilldowns are offered where the click makes sense: on a chart, from the tooltip for the series you clicked; on a table, from a configured column. The tooltip lists each configured target — dashboards by their menu label, plus View Related Logs and View Related Traces where those are enabled.
If a panel has no drilldown configured, clicking it does nothing — which is why a dashboard that's had drilldowns added is noticeably more useful than one that hasn't.
Practical notes
- Drill from the most specific panel you can. A panel grouped by service produces a scoped drilldown; a panel showing one aggregate number has nothing to scope by.
- Check a new drilldown returns something before relying on it. An empty result is usually a datasource or account-mapping problem, not an absence of data.
- Prefer Drawer for investigation and New tab for comparison.
Related
- Panel Types
- Ad Hoc Filters
- Trace View — where a traces drilldown ends up