Ad Hoc Filters
Ad hoc filters let you narrow a whole dashboard from the toolbar — pick a field, pick values, and every panel that queries that datasource is filtered. No panel editing, and nothing is saved to the dashboard unless you choose to keep it.
This is the difference between a dashboard that answers one question and a dashboard you can interrogate. When someone asks "is this happening in production too", you add a filter instead of building a second dashboard.
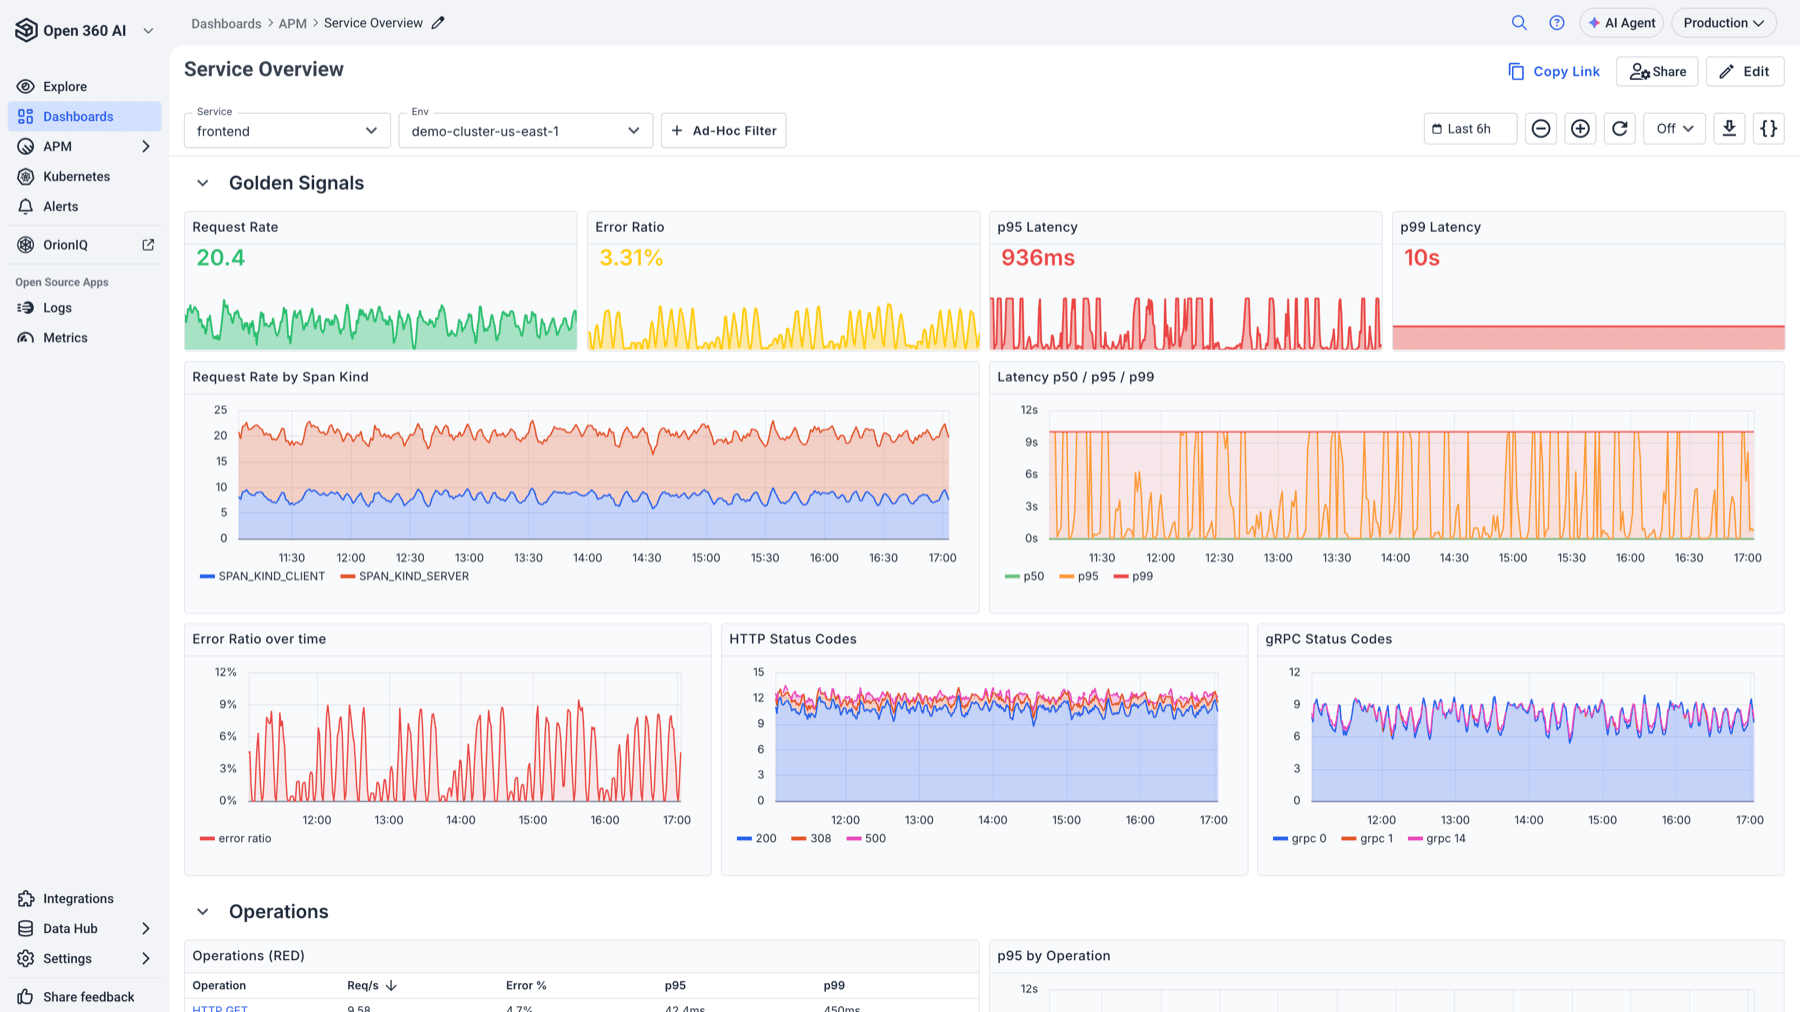
The Ad-Hoc Filter control sits in the dashboard toolbar, alongside the dashboard's own variables.
Add a filter
Select Ad-Hoc Filter in the dashboard toolbar and fill in the form:
| Field | What it does |
|---|---|
| Datasource | Which datasource the filter applies to. The picker groups them and labels each as Metrics or Logs, so a dashboard mixing Prometheus and OpenSearch panels can carry separate filters for each. |
| Label / Field | The label (metrics) or field (logs) to filter on. |
| Operator | How to compare — see below. |
| Values | One or more values, added as chips. Only shown for the operators that need them. |
Then select Apply. Nothing changes until you do, so you can build the filter without the dashboard reloading under you.
| Operator | Shown as | Meaning |
|---|---|---|
| is one of | =* | Field matches any of the selected values |
| is not one of | !=* | Field matches none of the selected values |
| exists | * | Field is present, whatever its value |
| does not exist | !* | Field is absent |
The operator list shows each symbol next to its name, which is handy if you also read the query it produces.
exists and does not exist take no values — they're the ones to reach for when you're chasing a labelling or instrumentation gap rather than a specific value.
Filters appear as chips in the toolbar. Each chip can be edited, removed, or disabled — disabling keeps the filter in place but stops it applying, which is far less annoying than deleting and rebuilding it while you compare two views.
How it interacts with variables
Ad hoc filters and dashboard variables do similar things by different means:
- Variables are authored into the dashboard. They're the intended dimensions — environment, cluster, service — and everyone who opens the dashboard gets them.
- Ad hoc filters are yours, added on the spot, for a question the dashboard's author didn't anticipate.
Where a dashboard defines an OpenSearch filter variable, its selection is mirrored into the same filtering mechanism, so the variable dropdown and your own filters compose rather than fight. Filters that come from a variable aren't shown as chips, because the variable's own control already represents them.
Scope and persistence
Filters apply to every panel that queries the matching datasource. Panels on other datasources are untouched — a metrics filter won't quietly change a logs panel.
Because filters live in the dashboard's URL state, a filtered view can be copied and shared. That makes them useful during an incident: narrow to the failing cluster once, send the link, and everyone is looking at the same slice.
Related
- Panel Types
- Drilldowns
- Dashboards Configuration Guide — variables and queries