Correlated Alerts
Some incidents are best detected by a sequence of logs, which may involve different log types, log fields, or even accounts.
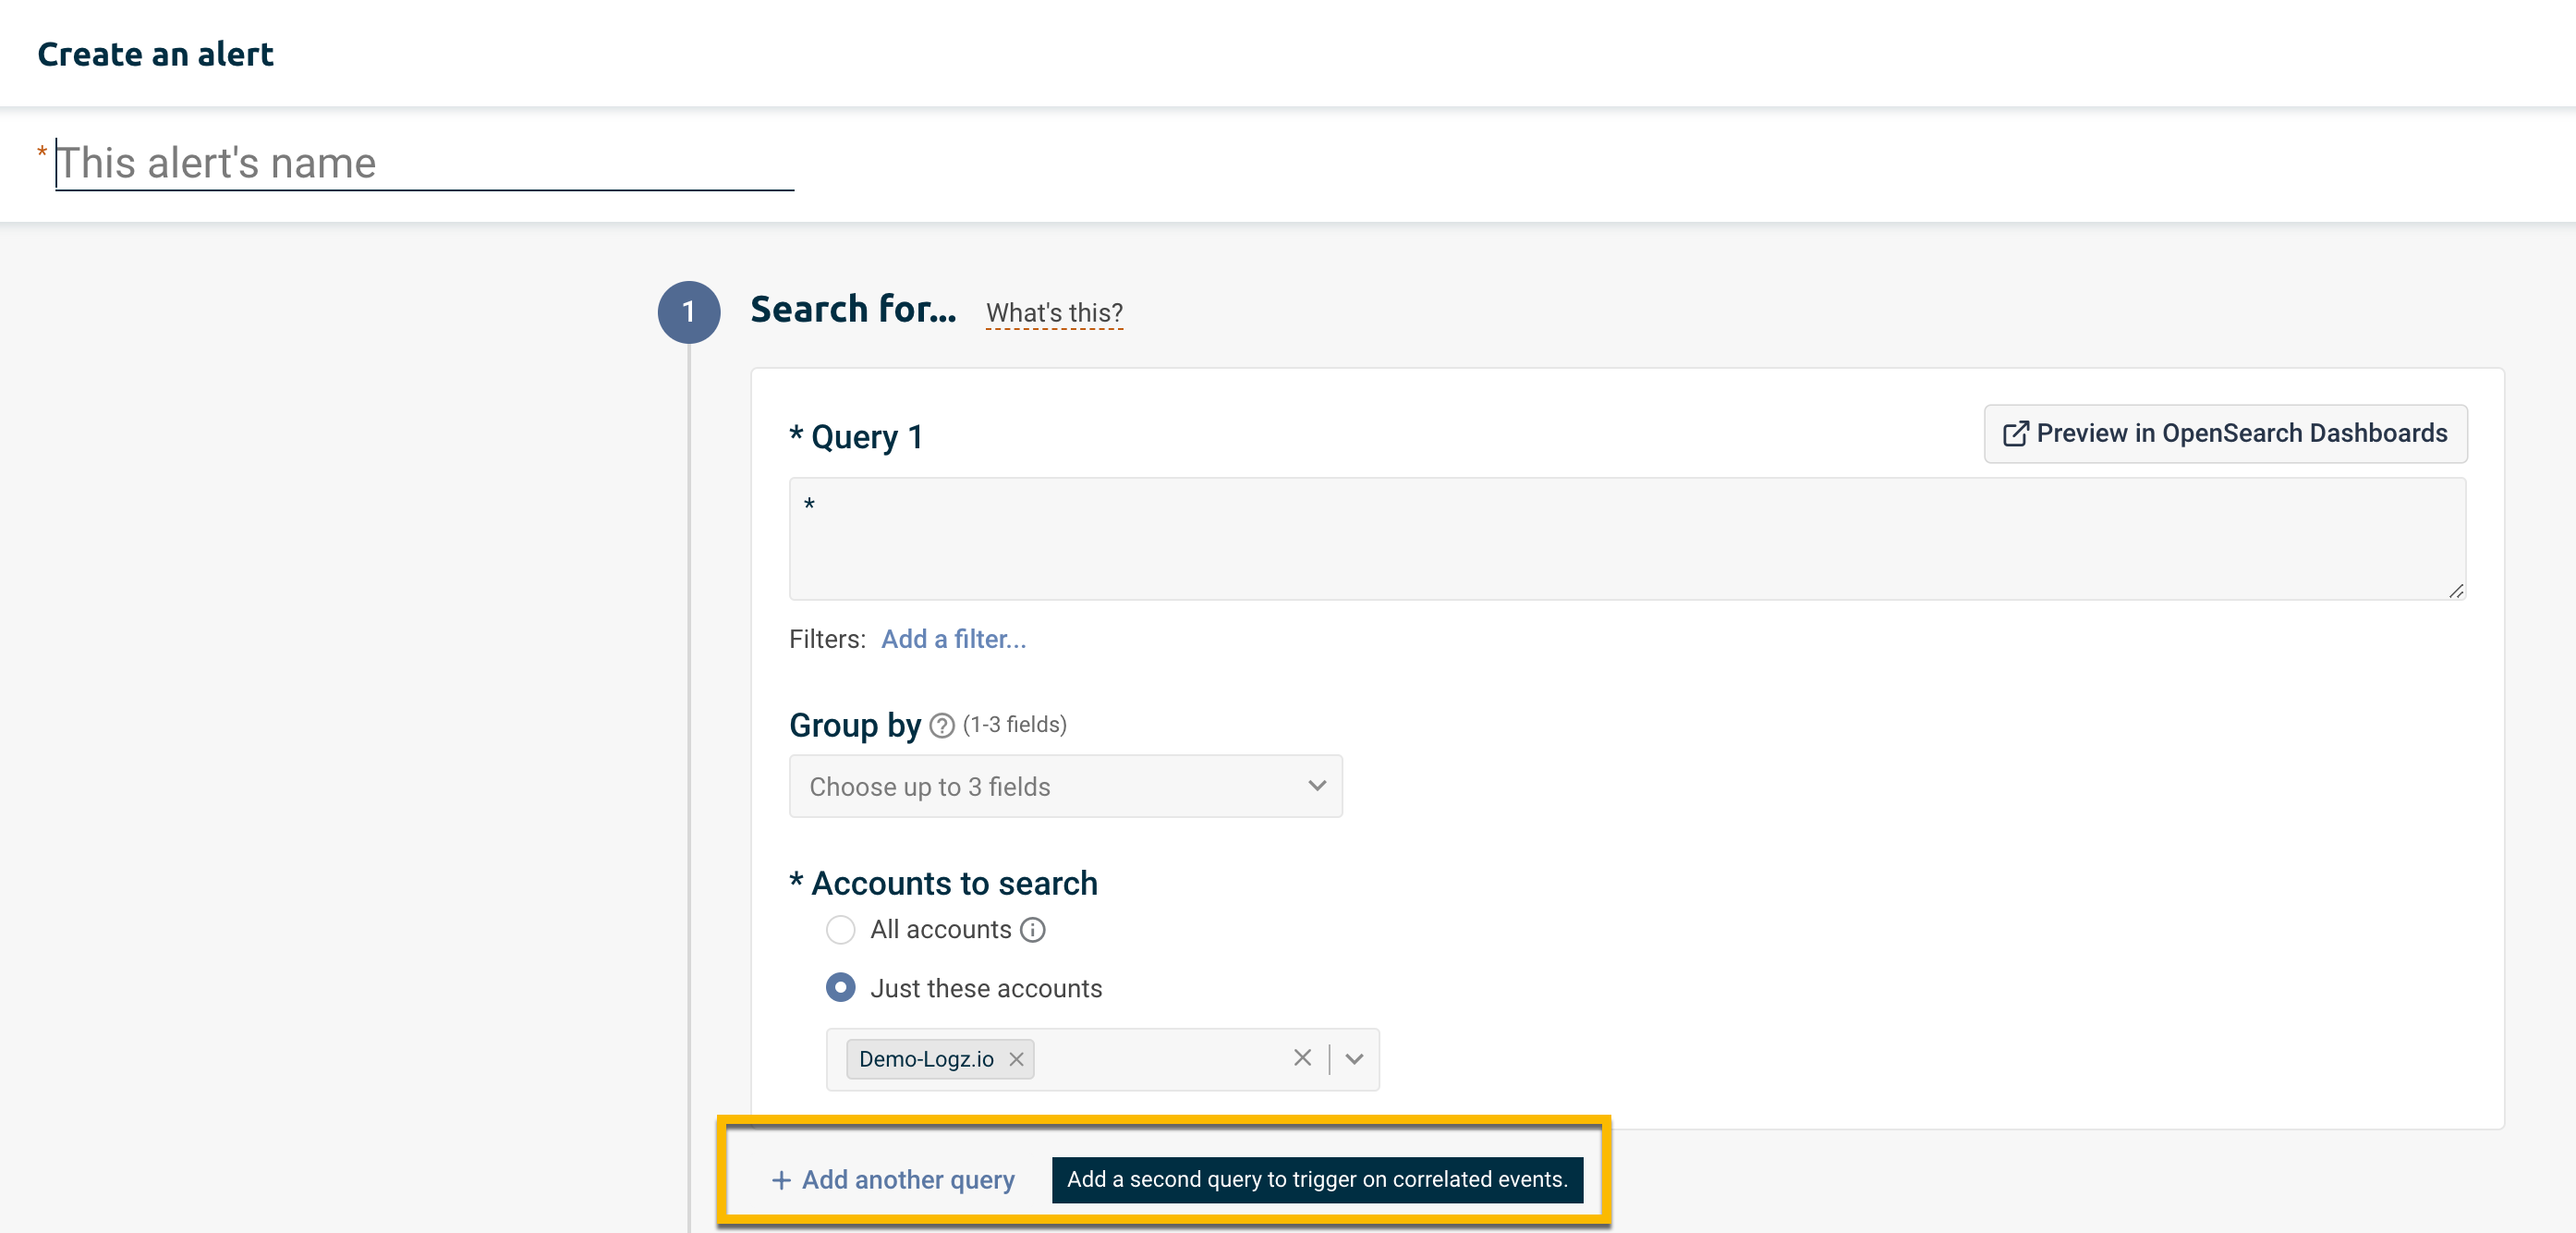
For example: a deployment on a particular microservice, coinciding with an error on another environment. In this case, 2 separate events can be correlated to trigger an alert.
Correlated alerts are instrumental for reducing false-positives. By defining a more specific use case that contains 2 scenarios, the trigger can be more sensitive and reduce unwanted noise.
Investigating correlated alerts
The best way to begin investigating a correlated event, is to click the link View in OpenSearch Dashboards in the notification.
Alternatively, you can visit the alerts Event Management page and click the button Investigate next to the relevant event.
When a correlated alert triggers, it writes 2 event logs - 1 per query. The event logs will be numbered 1/2 and 2/2, respectively. Each event log will have its own Investigate drilldown link.
The group-by fields used in the alert will be toggled into the table by default.
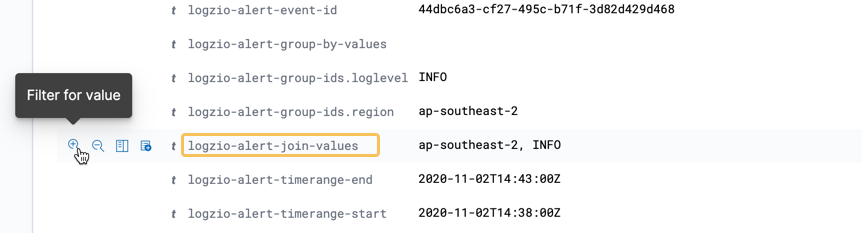
If the queries are joined, you can filter for the matching join values. Expand the event log to reveal the full list of fields. Hover over the field logzio-alert-join-values and click to filter for its value.