Getting Started with Logz.io
Logz.io is a scalable, end-to-end cloud monitoring service that combines the best open-source tools with a fully managed SaaS platform. It provides unified log, metric, and trace collection with AI/ML-enhanced features for improved troubleshooting, faster response times, and cost management.
Whether you’re new to Logz.io or need a refresher, join one us for a training session on the Logz.io platform!
Send your data to Logz.io
After setting up your account, you can start sending your data to Logz.io using various tools, integrations, and methods for monitoring Logs, Metrics, Traces, and SIEM.
The quickest way is through our Telemetry Collector, which simplifies data configuration with a single line of code, enabling full observability across your systems.
Get started with Telemetry Collector.
If you prefer a manual approach, Logz.io offers multiple methods tailored to different monitoring needs. Here are some popular options:
Browse the complete list of available shipping methods here.
Parsing your data
Logz.io automatically parses over 50 log types.
If your log type isn't listed, or you want to send custom logs, we offer parsing-as-a-service as part of your subscription. Just reach out to our Support team via chat or email us at help@logz.io with your request.
Additional resources
Learn more about sending data to Logz.io:
Navigate your logs with Logz.io Explore
Logz.io's Explore lets you view, search, and query your data to analyze code, debug issues, and get guidance with its integrated AI Agent.

Key capabilities in Explore include:
Create visualizations with Logz.io's Infrastructure Monitoring
Logz.io's Infrastructure Monitoring provides real-time visibility into the status of your distributed cloud services. It enables your team to create custom dashboards to oversee deployments, manage incidents, and prevent outages in complex environments.

After sending your metrics to Logz.io, you can:
Build Metrics visualizations with Logz.io
You can also:
- Create metrics-based alerts
- Use Dashboard variable for filtering and drilldowns
- Mark events on your Metrics dashboard based on data from a logging account, with Annotations
Additional resources
Dive deeper with Logz.io's Distributed Tracing
Leverage Logz.io’s Distributed Tracing to gain deep insights into your microservices' behavior, enhancing performance and streamlining investigation and troubleshooting.

To make the most of Distributed Tracing, check out these guides:
Secure your environment with Logz.io's Cloud SIEM
Logz.io Cloud SIEM (Security Information and Event Management) consolidates security logs and alerts across distributed environments, enabling your team to investigate incidents from a single observability platform.

Get Started with Cloud SIEM:
- Quick start guide
- Investigate security events
- Threat Intelligence feeds
- Configure security rules
- Dashboards and reports
Manage and optimize your Logz.io account
Admins can control user permissions, manage accounts, set up SSO, and handle data archiving.
The following list explores the more common use cases for Logz.io's account admins:
- Setting and editing user permission levels
- Managing main and sub accounts
- Optimizing account volume usage
- Setting up SSO access
- Archiving and restoring data
In addition, Logz.io's Data Hub helps you manage and optimize your Logz.io products by offering tailored recommendations and a quick and easy way to control your logs and metrics usage. Account Admins can use Data Hub to:
- Analyze and optimize logs and metrics usage
- Create graphs and dashboards from your logs
- Index and monitor your traces
- Archive and restore your data
Get a detailed overview with the Home Dashboard
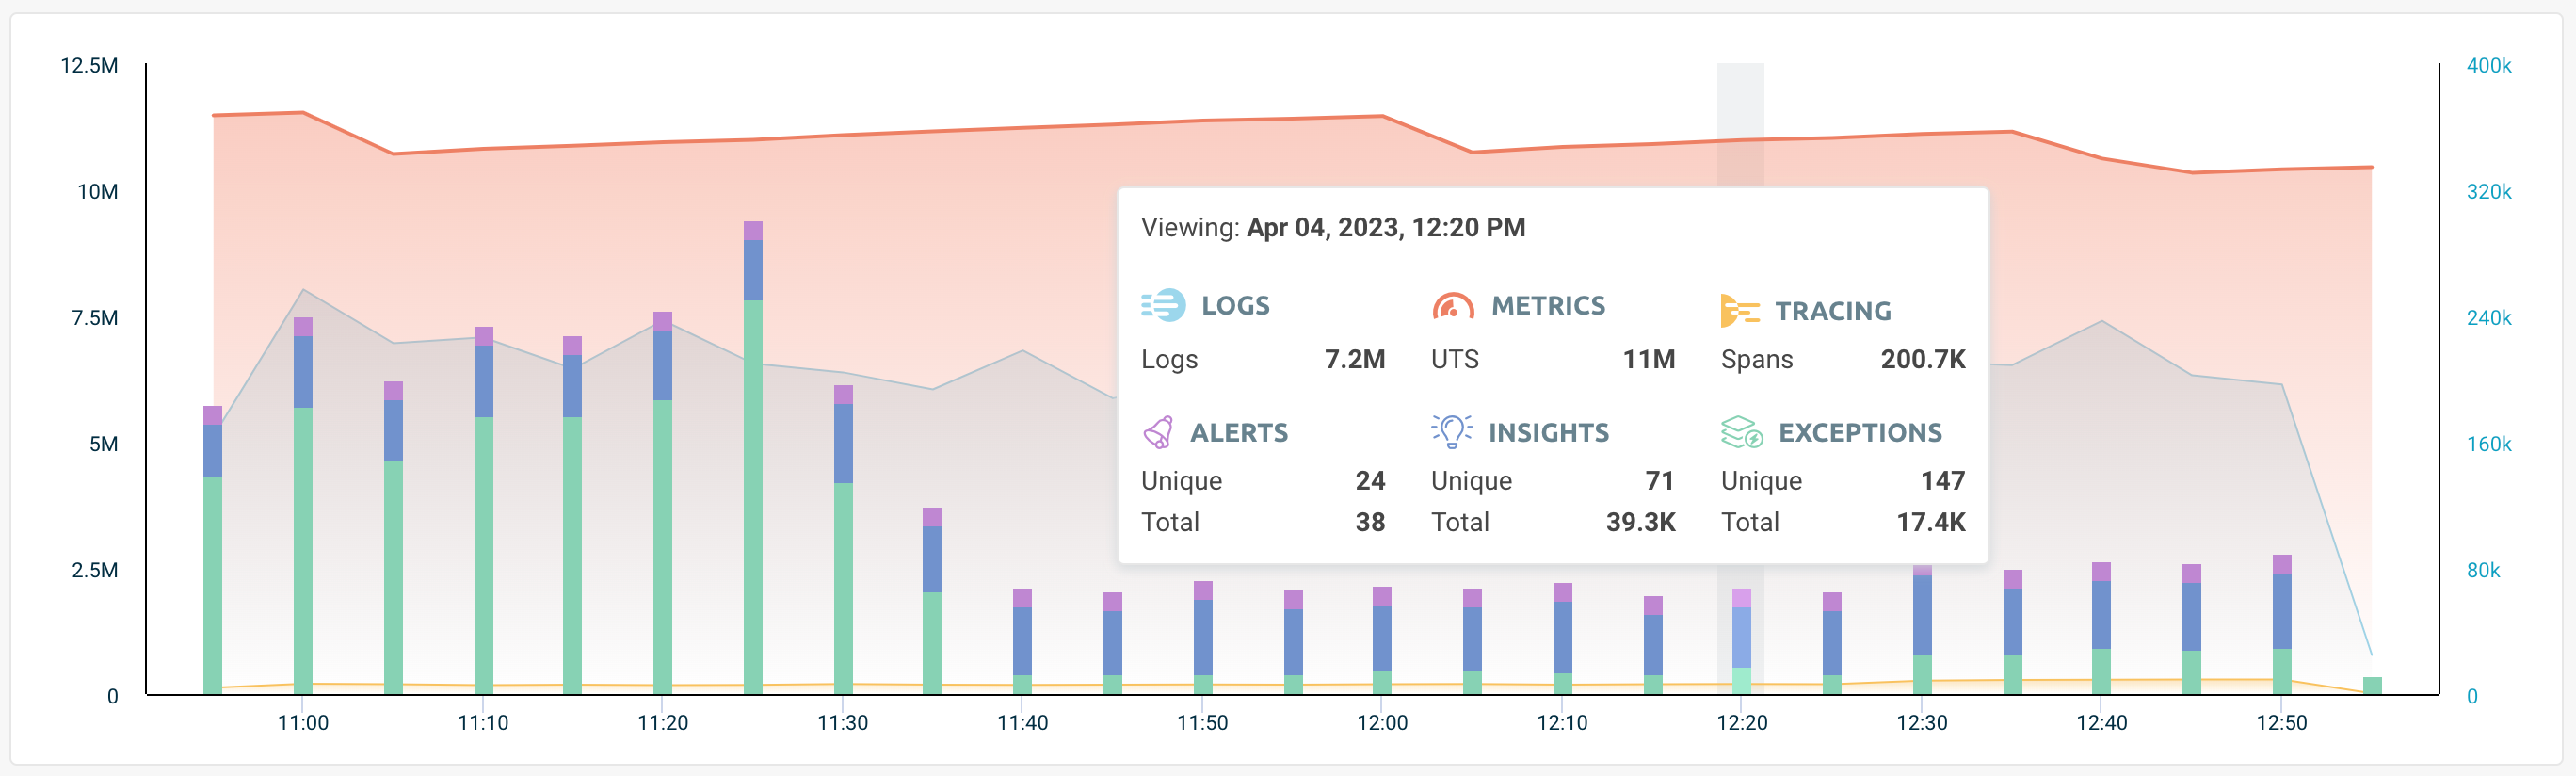
The Home Dashboard provides a comprehensive view of your account's data, including logs, metrics, traces, alerts, and insights. Access it by clicking the Home icon in the navigation.
Learn how to utilize your Home Dashboard.

1. Customize your view
Select elements like logs, metrics, and traces to display or hide, with immediate graph and table updates. Click on one of the boxes to add or remove them from your view. The graph and chart will be updated immediately.
For example, clicking on Insights or Exceptions will remove all of them from the graph and the table, allowing you to shift your focus according to your monitoring needs.

2. Graph overview
Visualize data over time and explore detailed event breakdowns.
3. Table overview
At the bottom of the page, your data is displayed in a table format, breaking down events by type, severity, grouped count, and the date they were last triggered.
Hover over an event to reveal the Investigate button, which opens the event in OpenSearch Dashboards for deeper analysis.

4. Search and access dashboards
The Home Dashboard provides quick access to your logs and metrics dashboards, enabling you to search across all available dashboards in your account. Simply start typing to find a specific dashboard, and click to open it in a new tab. The view also shows recently accessed dashboards, and you can mark essential ones as favorites for easy access.
5. Set your time frame
The top of the page shows the last data update, helping you stay current.
You can adjust the time range to view data from the last 2 to 24 hours. The Home Dashboard will then refresh to display data for the selected period.