Intro to Explore
Explore provides a unified dashboard for monitoring your data, offering a quick and efficient way to identify and debug issues. Designed for investigating and analyzing large data volumes, Explore allows you to use filters, queries, and searches to pinpoint and delve into problems effortlessly.
Query and search
Explore uses an enhanced Lucene query language for log searches, featuring autocomplete suggestions and syntax highlighting for faster, more accurate queries. Start typing to view available fields and operators. For example, you can search for logs where logSize exceeds a certain value or find messages containing specific words.

Explore also offers Simple Search, allowing you to build queries by selecting fields, parameters, and conditions. If a value isn’t listed, type its name and click the + button to add it. Free-text searches are automatically converted into Lucene queries.
Filters
The filter pane helps refine and narrow search results.
- Account Selection: Choose the relevant account before filtering.
- Available Fields: Display fields from currently visible logs.
- Other Fields: Show fields stored in your database but not currently visible in logs.
- Favorites: Click the ⭐ icon to save frequently used fields for quick access.
- Special Fields: These cannot be filtered but can be added to the table or used as field exists filters.
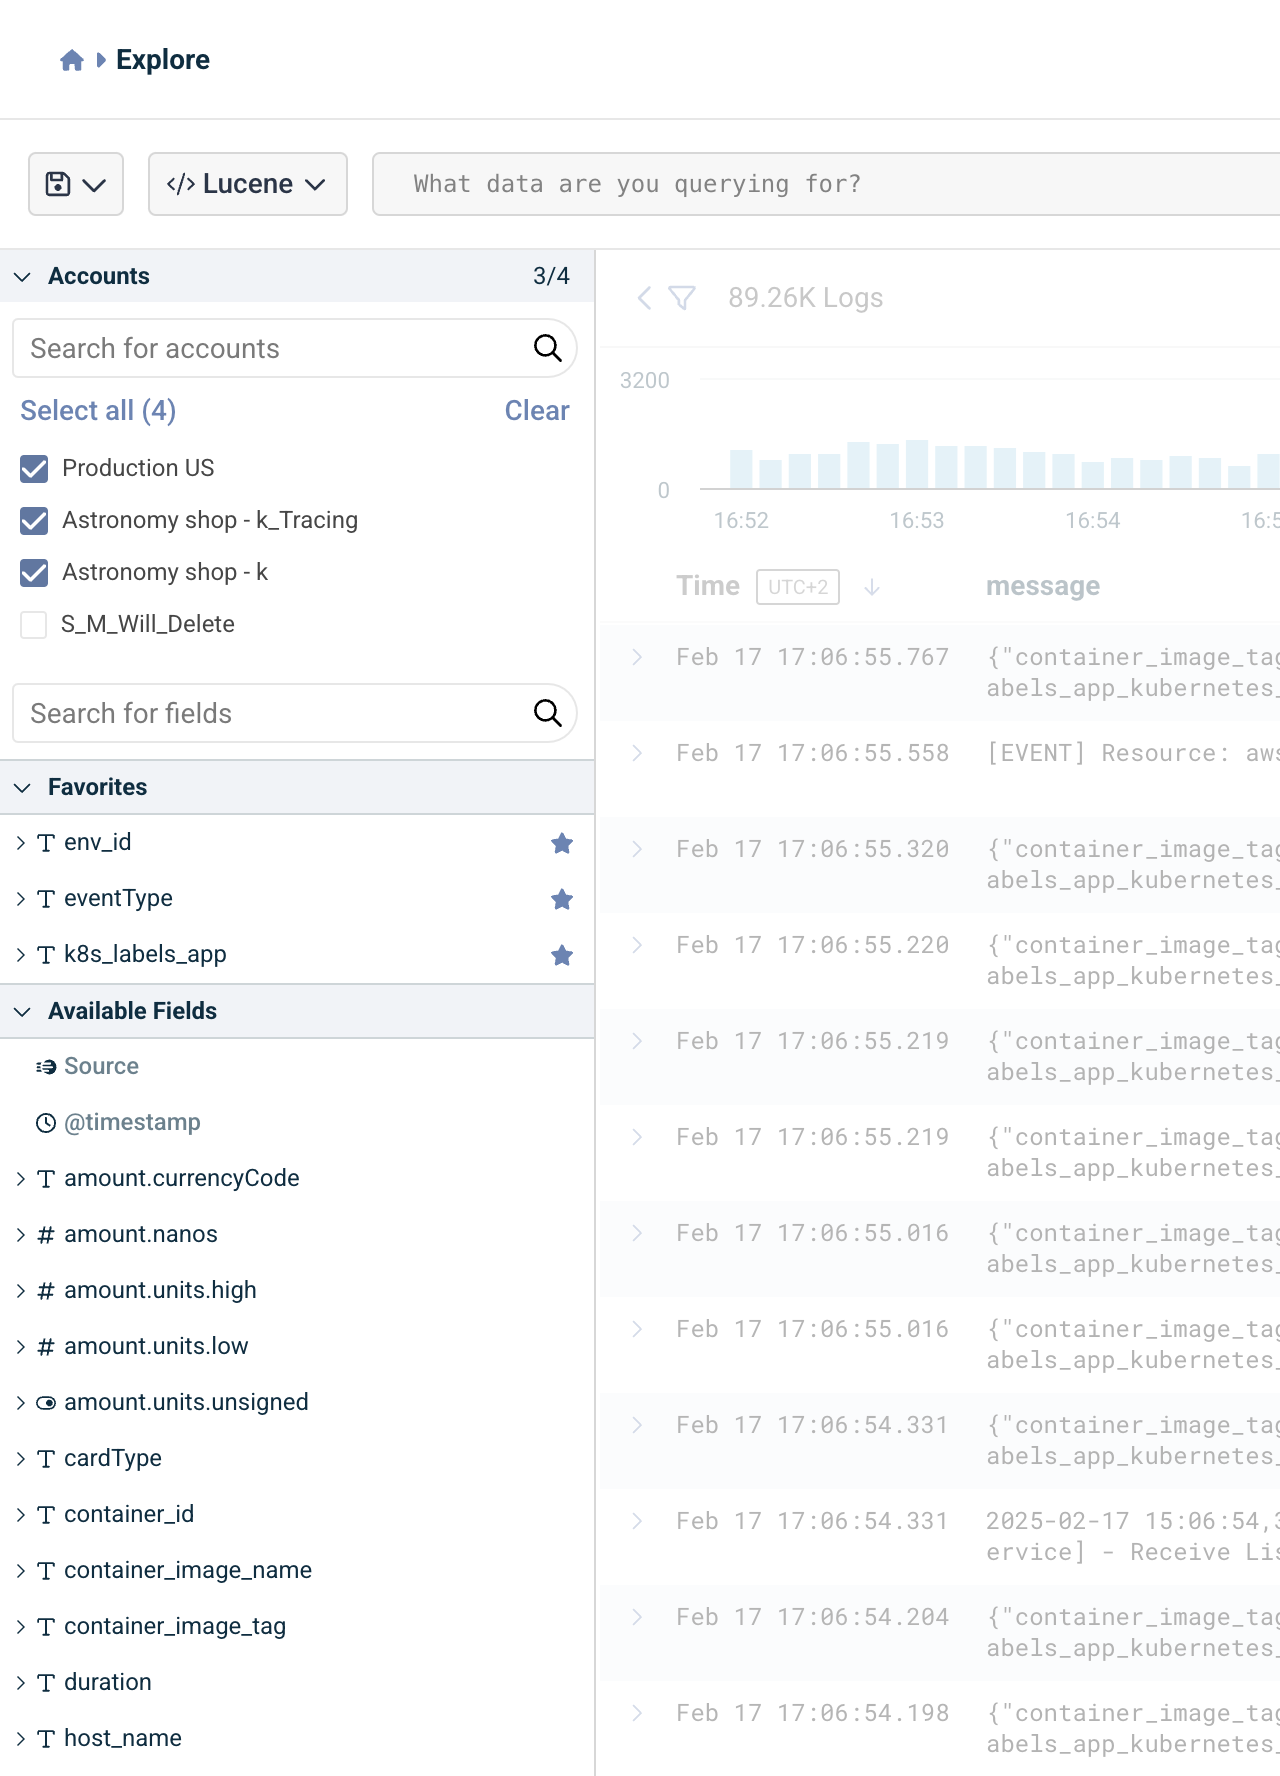
Click a field to explore its values, which are dynamically fetched based on the selected timeframe and account. A percentage indicator shows how often a value appears in the logs. Once selected, field values move to the top of the list for easy management.
Editing filters
Lucene Search:
Click the filter to modify the field, value, or condition, then click Save.

Simple Search:
Click the in-line filter, choose Edit, modify the value, then click Apply.

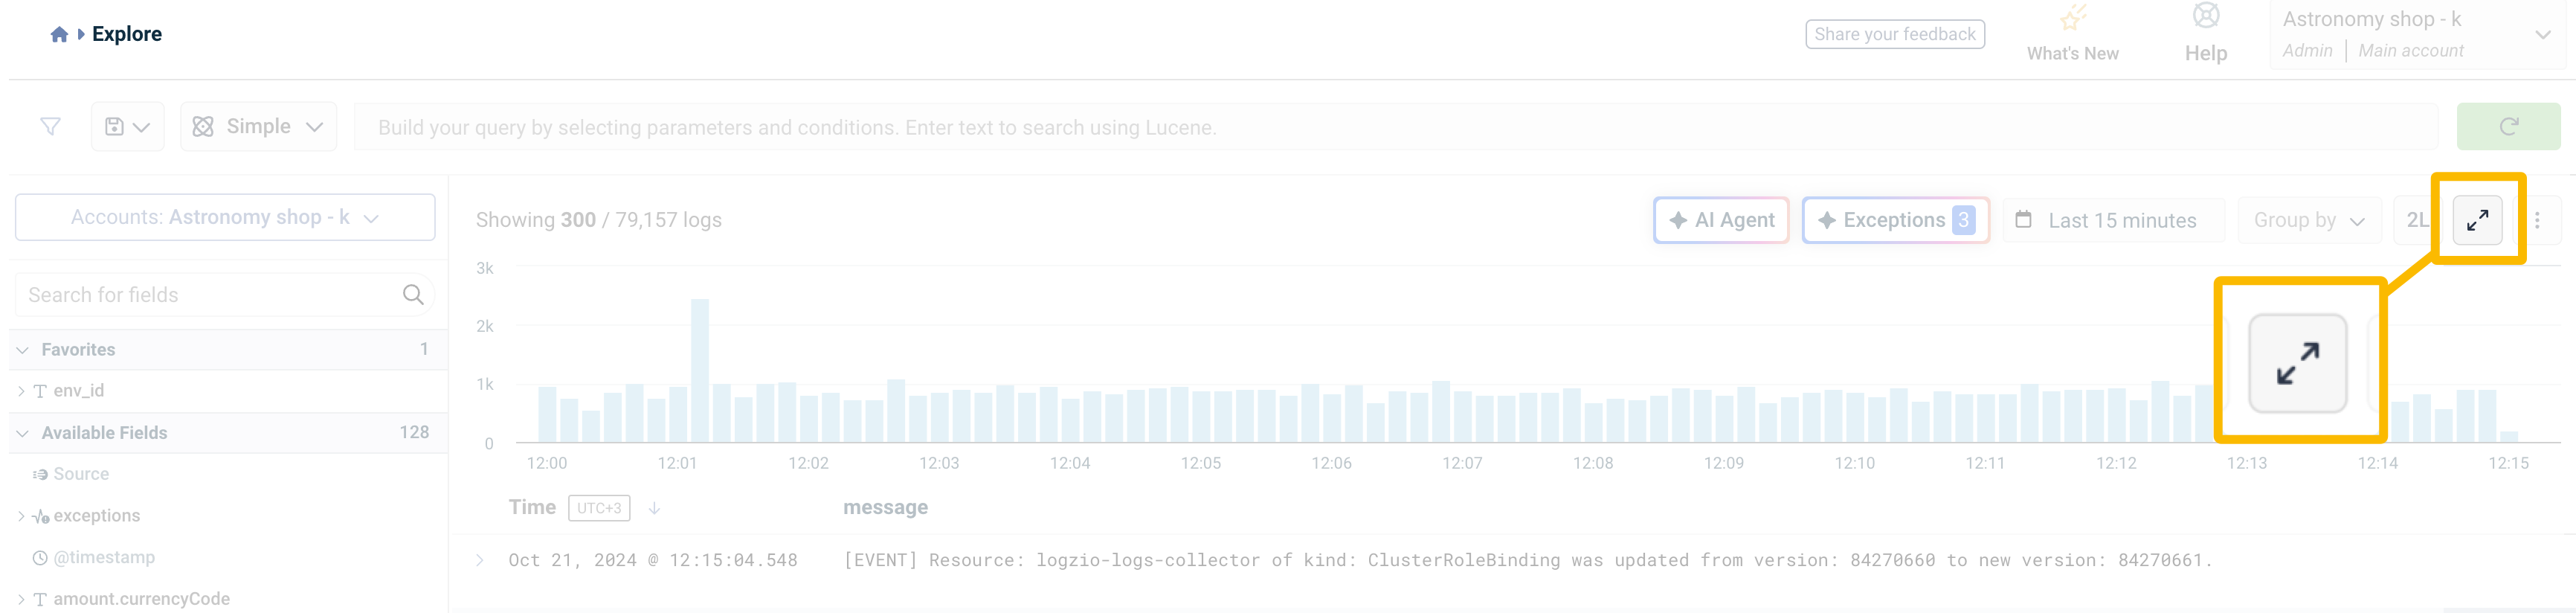
Graph View
Visualize trends over time and group data for deeper insights.
Hover over the graph to see additional details about each data point. Click and drag to zoom in on specific timeframes. Resize the graph using the arrow button in the top-right corner.
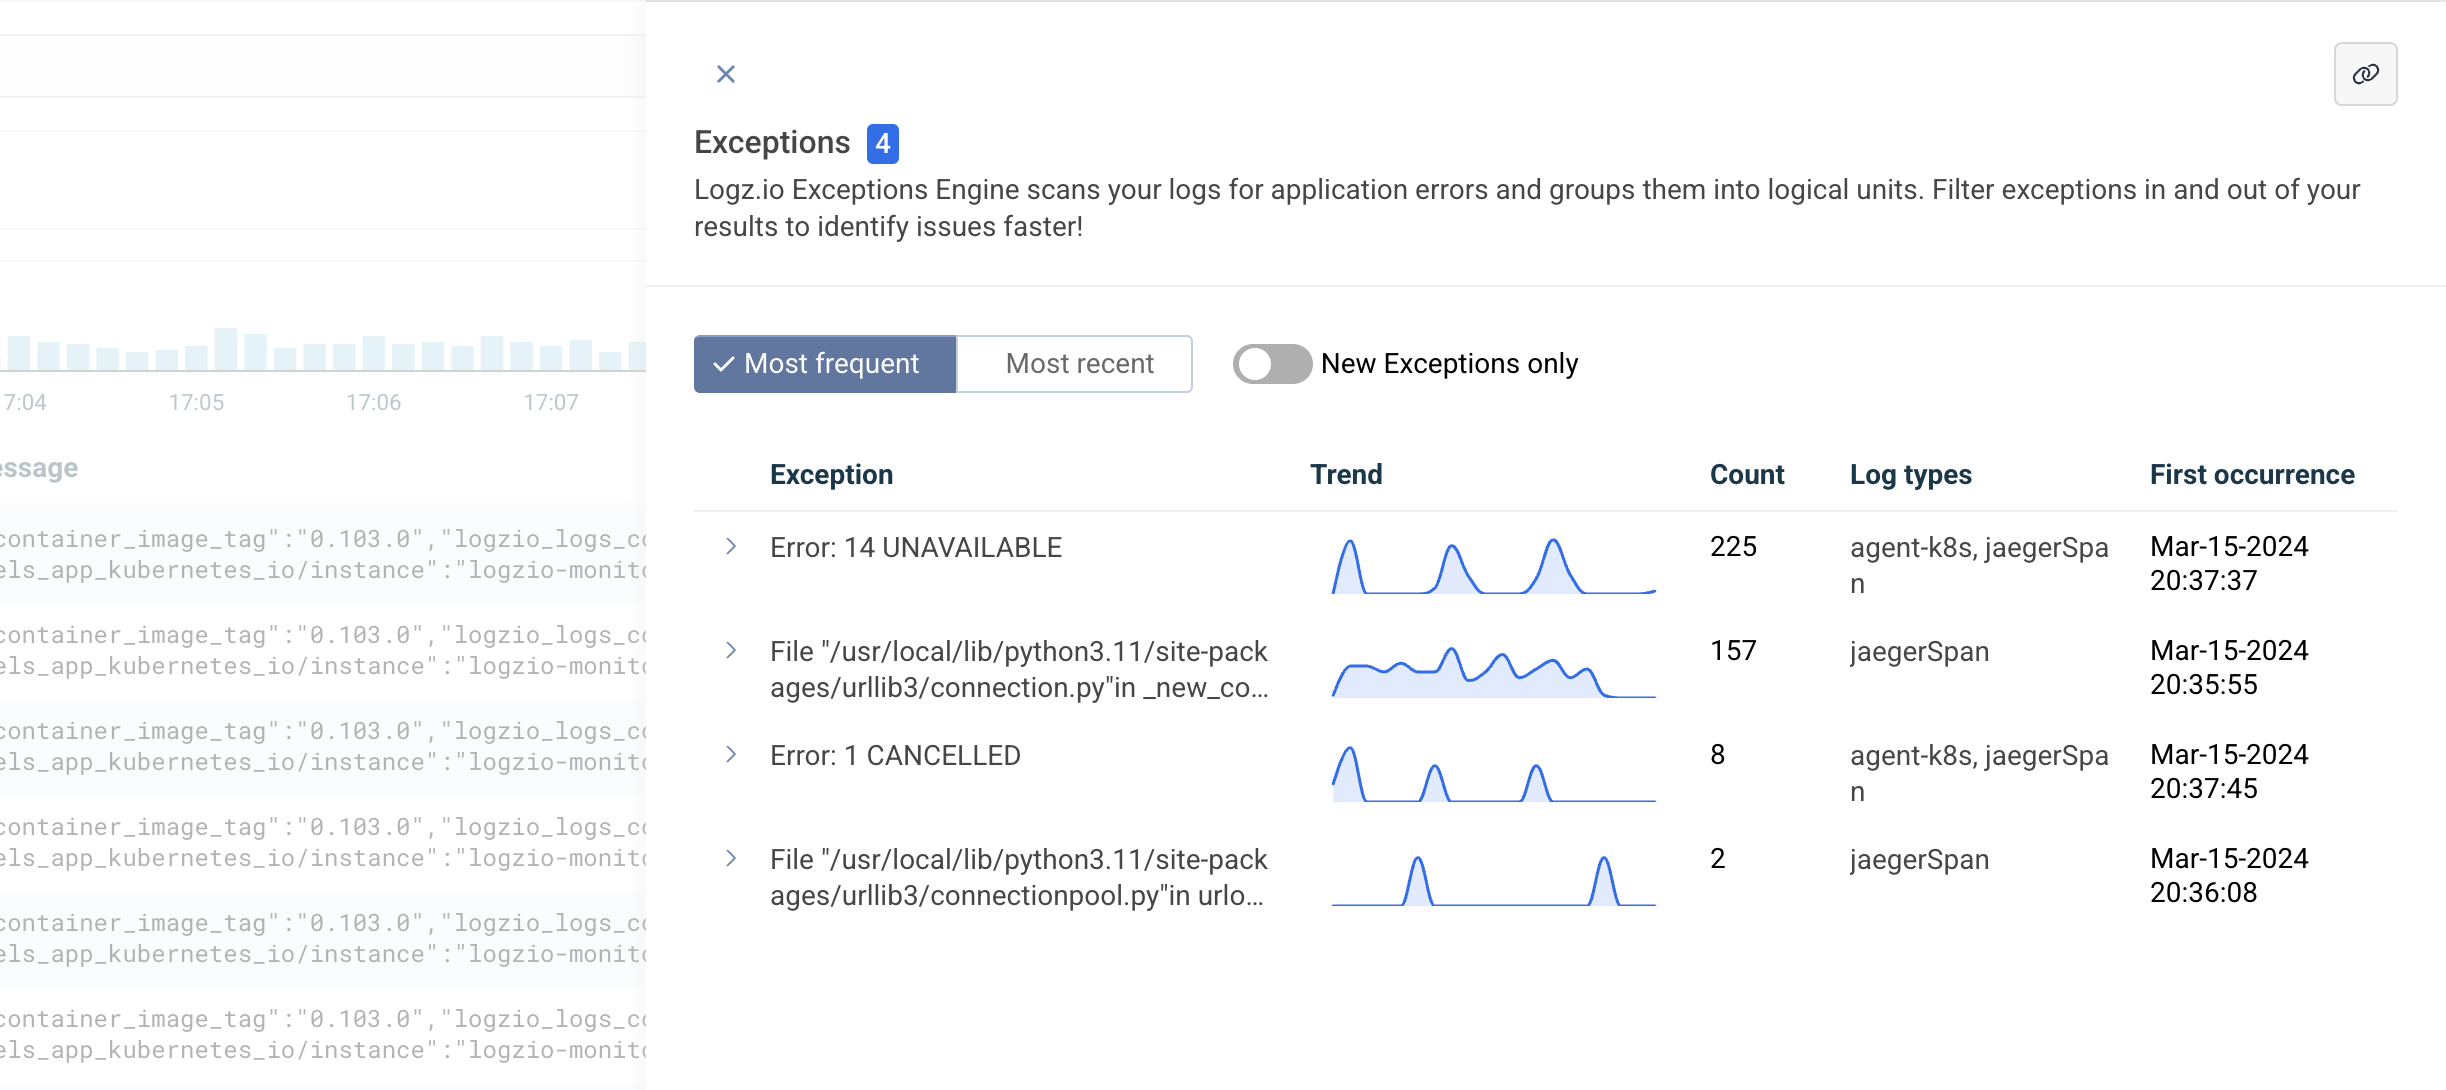
Exceptions
Logz.io Exceptions automatically detects and highlights errors in Explore.
The exception count is displayed for every query. Click the Exceptions button to open the Exception Quick View for a detailed breakdown.
Learn more about Exceptions.
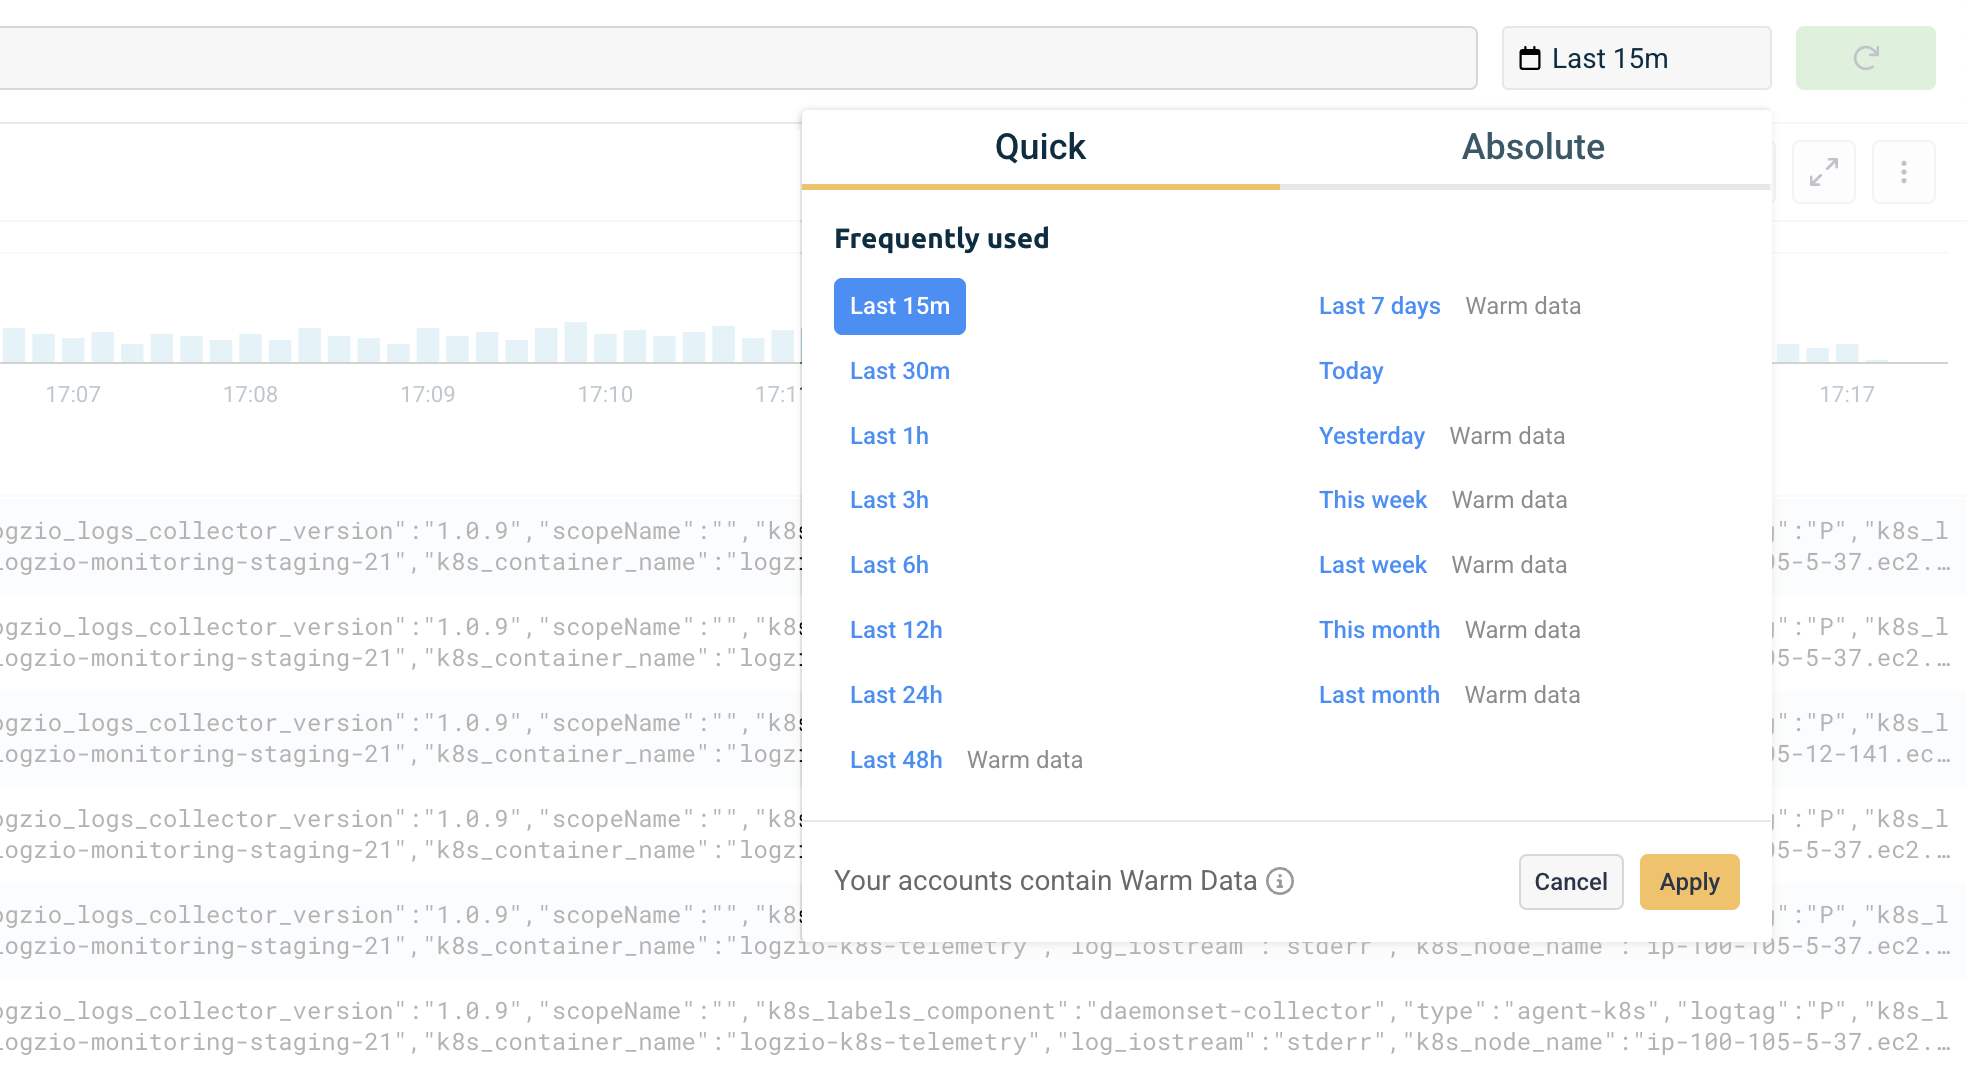
Choose Timeframe
The default timeframe is the last 15 minutes. Click the time selector to choose a custom range.
AI Agent
Click AI Agent to activate an AI-powered, chat-based interface that lets you engage in a dynamic conversation with your data. Use one of the pre-configured prompts or type your own question to get real-time insights about your metrics, anomalies, trends, and the overall health of your environment.

Visualize
The default graph view groups all fields. Customize the visualization by:
- Grouping by specific fields.
- Comparing different time frames.
- Adjusting the time interval or Y-axis scale.
- Adding Deployment markers.
When using Group by, the graph displays up to 10 values. Any additional values are grouped under Other. Entries with empty or undefined values for the selected field will appear under Missing.
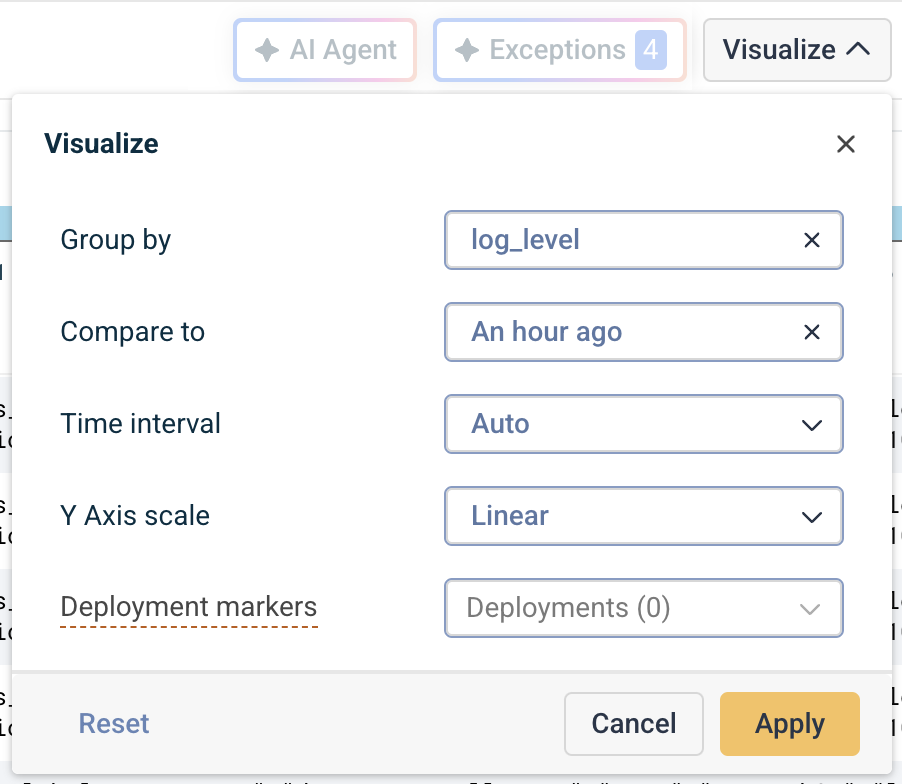
Table Density
Adjust the table view using the 1L button:
- 1 Line → Compact view.
- 2 Lines → Displays two log lines.
- Expanded → Shows full log details.
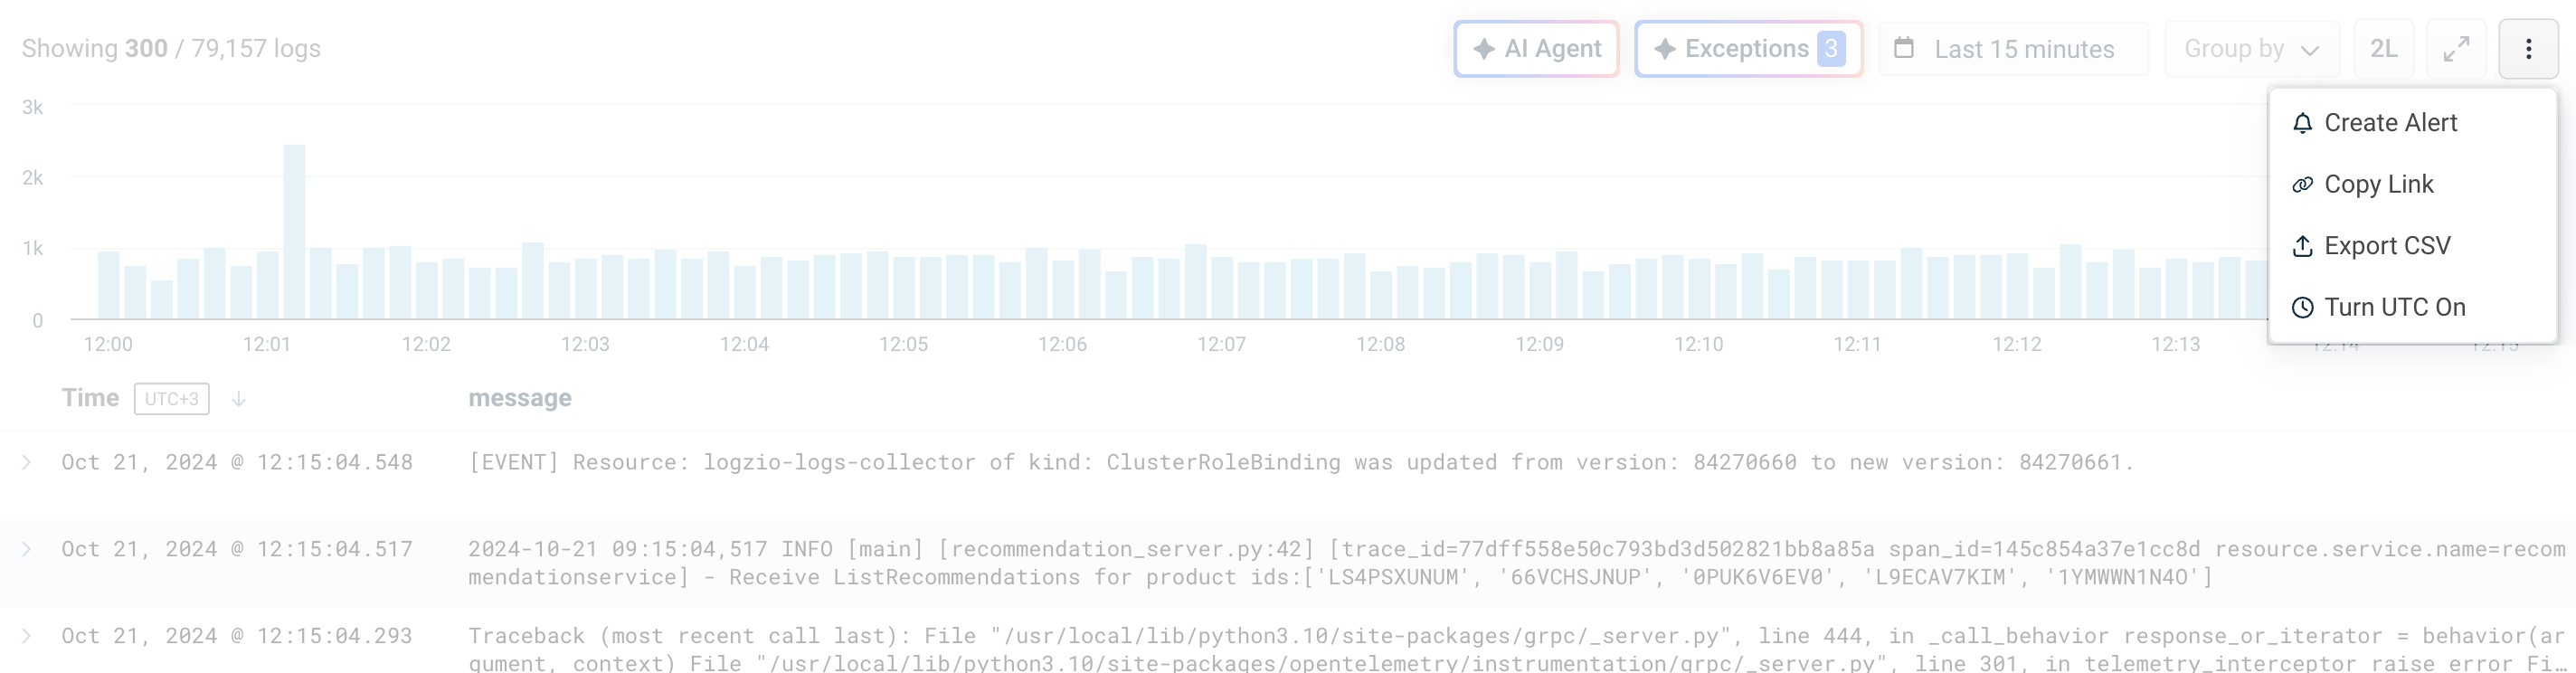
Create Alert, Copy Link, Export CSV, Turn UTC On
The ⋮ menu offers additional options for Explore, including:
- Create Alert: Opens an alert configuration with your current filters applied.
- Copy Link: Generates a URL with your current view, which you can share with team members. You need to be logged in to Logz.io to view it.
- Export CSV: Exports up to 50,000 logs to a CSV file, including the timestamp and log message.
- Turn UTC On: You can view your data in either UTC or your browser’s local time zone. For clarity, the time column in your log table will display the active time zone.