Intro to OpenSearch Dashboards
OpenSearch Dashboards (OSD) is where you search and query your logs to figure out what happened. It is optimized for debugging and troubleshooting issues as quickly and effectively as possible.
You can use the Discover page to filter logs, search for specific events, and create alerts based on your search queries.

OpenSearch Dashboards Overview
OpenSearch Dashboards is designed to help you investigate massive volumes of data as quickly as possible. Filters, search phrases, and a date picker or relative time range selector are all designed to help you find the logs you want. Together, they are the query criteria that determine which logs are returned from your logging database.
1. Select Account
First, decide which accounts you want to search. Managing your accounts is the first step to successful logging. You can create sub accounts to separate data by environment, microservice, team, and more. Learn more about account management and sub accounts.
2. Apply Filters
OpenSearch Dashboards filters offer the most convenient, powerful, and flexible method for querying logs.
Filters can be used on any mapped fields and can take any number of forms: filter for field exists or does not exist, filter for a field with an exact value match or a field that contains a value among the results, and more. Learn more about OSD mapping.
One advantage of OpenSearch filters is that they provide guidance that is specific to your dataset. When OpenSearch maps your data to fields, it also determines which filtering options are relevant. When you add filters, only relevant options appear in the dropdown menus.
Another advantage is that filters can be inverted, temporarily disabled, edited, and more using the filter menu.
3. Use the search bar
You can type a search query in Lucene syntax or DQL. It is an alternative to filtering that requires a little familiarity with the search syntax. Almost anything that can be defined in the Search bar can be accomplished using filters as well.
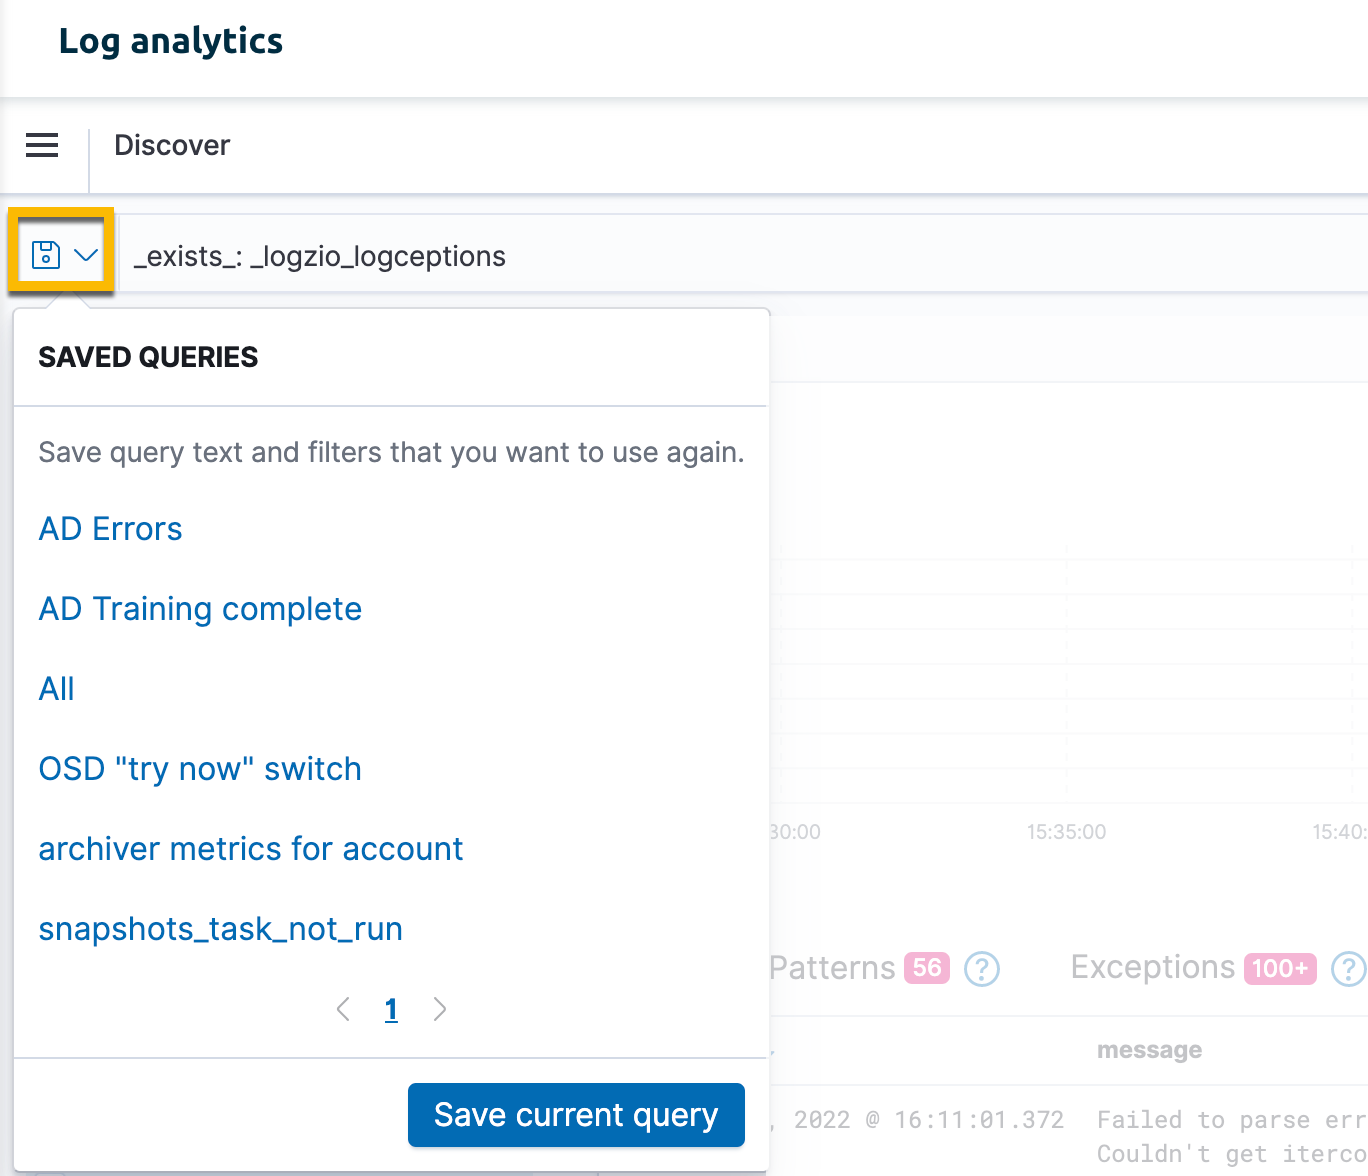
You can also save your search query in case you want to use them again in the future. Save or load search queries by clicking on the Save icon located next to the search bar.
4. Change your time frame and date
The default time frame in OpenSearch Dashboards is always the last 15 minutes.
You can select the time frame in any number of ways, including relative times such as the last hour, today so far, or the day before yesterday, or use absolute times by calendar dates and timestamps.
5. View log results
The logs returned by your search are your results - aka "hits". Depending on the time frame you've selected, the results can be set to continuously auto-refresh and can be quite dynamic.
Histogram - The Histogram shows the distribution of logs over time. It is often easier to see when logs were sent when graphed directly on the timeline. You can also select a time range directly from the histogram using a drag-and-drop motion or by clicking a data bar.
Logs - The log document table displays a preview of your top results, arranged with the most recent results at the top. The default fields are time and message, but you can toggle the fields that interest you in and out.
To expand a log, click it and review the complete log mapped into field:value pairs. You can also switch to the raw JSON.
Patterns - Logz.io groups your logs using advanced clustering techniques to help you identify similar logs by groups, reducing the amount of logs to review. Patterns also help to surface issues and errors that might otherwise go unnoticed. Learn more.
Exceptions - Logz.io Insights Engine scans your logs for application errors and warnings to help you identify issues that require your attention. Learn more.
6. Take action following your results
The number of hits shows you the number of results returned by your query. This is the count of the total number of log documents that answer the query criteria.
If you click the Inspect function, you can view the query as sent to OpenSearch. This is useful if you are using the Logz.io API, for example.
Once you've refined a query to the point that it returns exactly what you are looking for, you can be proactive in any number of ways:
- Create an alert to trigger automatically and send out notifications to your preferred endpoints. Learn how to configure an alert.
- Save the search to display it in visualizations and dashboards or to load it in the future.
- Share results with colleagues or external stakeholders.
- Export results to a spreadsheet.
Additional resources
Need help with parsing fields? Our support team is available to assist you in parsing your logs and extracting fields, making it easier to query your logs and create meaningful visualizations and alerts.