Getting Started with Kubernetes 360
Kubernetes 360 is part of Logz.io's Open 360 AI, a unified platform combining a true log analytics solution, the best Prometheus metrics monitoring, and the value of distributed tracing powered by Jaeger.
Kubernetes 360 lets R&D and engineering teams monitor and troubleshoot applications deployed in Kubernetes environments.
The platform utilizes Kubernetes' numerous advantages for R&D and dev teams, allowing you to monitor application SLOs in a simple, efficient, and actionable manner. Kubernetes 360 offers flexibility and visibility while providing service discovery, balancing load, and allowing developer autonomy and business agility.

To activate your Kubernetes 360 dashboard, connect your Kubernetes data quickly and easily through Logz.io's Telemetry Collector.
If you already have Kubernetes 360 data in your Logz.io account or prefer connecting Kubernetes manually, follow our Kubernetes 360 Prerequisite guide.
Once everything is up and running, you can use your Kubernetes 360 application.
Kubernetes 360 overview
You can use Kubernetes 360 to suit your monitoring and troubleshooting needs. To help you get started, we'll break down the different options, how you can access them, and how they can help you and your team.
Filters
First, choose the environment you'd like to view. Environments with many users, teams, or projects use a namespace to bundle relevant clusters and nodes. This filter allows you to focus on all elements inside a specific namespace.
Next, choose whether to view the environment's clusters, namespaces, or deployments. Each dropdown menu includes all clusters and nodes in the chosen Kubernetes account, and you can use the search bar to find and add nodes to your view easily.

AI Agent
Click the AI Agent button to activate an AI-powered, chat-based interface that lets you engage in a dynamic conversation with your data. Use one of the pre-configured prompts or type your own question to get real-time insights about your metrics, anomalies, trends, and the overall health of your environment.

View
You can switch your view to filter by the following resources: Node, Pod, Deployment, Daemonset, Statefulset, or Job.

In addition, you can also switch between the Map and List views, according to your monitoring needs. Note that the Pod view can only be seen as a list.
When switching between views, the main cards change to represent the different resources. Each card includes several essential measurements, such as average CPU and memory usage, and a rundown of the resource’s status. The cards help you quickly identify which resources require your attention by marking failings or issues in red.
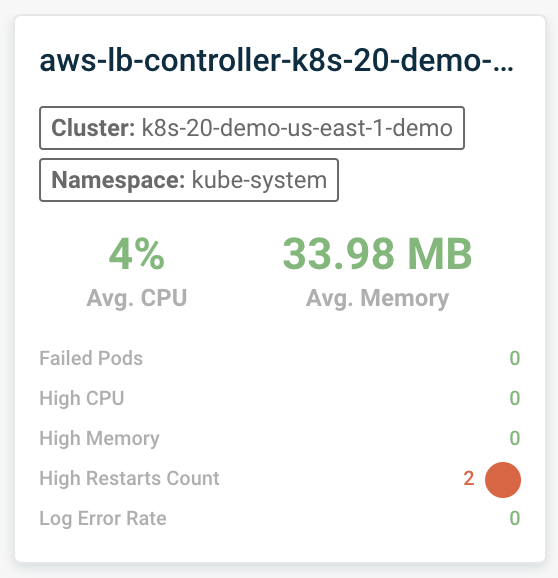
You can dive deeper into each card by clicking on it and opening the Quick view menu.
Search
You can search your environment for specific elements you’d like to view. Note that the search focuses on the elements' names, not their status, cluster, namespace, etc.
Auto refresh
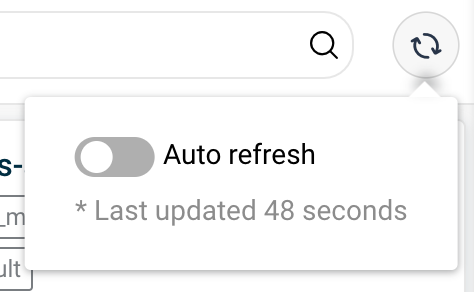
You can set your Kubernetes 360 application to auto refresh every 60 seconds, to ensure you view the most recent data. To do so, hover over the refresh button and click the auto refresh toggle. You can also click on the button to manually refresh the data.
Change your metrics view
By default, Kubernetes 360 provides an overview of your current environment. Use the bottom menu to focus on different metrics according to your monitoring needs:
- Status - Understand which pods are running, failing, pending, or which pods succeeded.
- CPU - View CPU consumtions by percentage: 0-50%, 50%-80%, 80%-100%, or over 100%.
- Memory - Know how much memory each pod uses: 0-50%, 50%-80%, 80%-100%, or over 100%.
- Restarts - Get a numeric overview of how many restarts occurred in each pod: 0, 1-10, 11-20, or over 20 restarts.
- Log Error Rate - Analyze the percentage of log errors that occurred and how many pods were affected. How do we calculate the log error rate?
- Security risks - Presents how many potential security risks are in each of your pods.
Quick view
Clicking on one of the cards or rows opens the quick view menu. This menu provides additional information about each element, allowing you to investigate and understand what’s happening inside your Kubernetes environment.
For each available view - Deployment, Pod, Node, Dameonset, Statefulset, and Job - you can access the quick view to gain more information, such as:
- Cluster - The cluster associated with the chosen view.
- Namespace - The unique namespace.
- Status - Indicates whether that condition is applicable, with possible values True, False, or Unknown.
- CPU - Amount of CPU used. You'll see an indicator stating no limit if the CPU is not capped.
- Memory - An average calculation of how much memory is in use.
- Uptime - The duration of how long the chosen view has been running.
- Security risks - The number of potential security risks.
And of course, activate AI Agent to open the AI-powered, chat-based interface to where you can engage with and query your data further.

Click on See Metrics, See Traces, or See Logs to navigate to each dashboard's relevant view.
Quick view tabs
Use Telemetry Collector to configure and send data quickly to enrich your existing and newly sent data.
Each quick view includes several tabs that provide additional information you can act on. You can choose the time frame for each tab by clicking on the date bar at the top.
Pods tab
The Pods tab provides a list of all pods related to this node. The table includes each pod's status, the number of containers they’re in, and how much CPU and memory they use. Clicking on one of the pods will lead you to that pod's quick view menu.
Logs tab
The Logs tab shows each log line's time, log level, and message. The search bar supports free text and Lucene queries, allowing you to search for specific logs.

Metrics tab
The Metrics tab presents useful data in graph form. These graphs provide a view of Replicas Over Time, CPU Usage (cores) per pod, Memory Usage Per Pod, CPU Usage, Requests and Limits (Cores), Memory Usage, Requests and Limits, and Received & Transmitted Bytes.

Traces tab
The Traces tab includes all of the spans in this deployment, including the following:
- Time
- Trace ID
- The service related to the span
- Which operation ran
- The duration of the run, represented in milliseconds
- Status code indicating whether a specific HTTP request has been successfully completed

Trace quick view
Click on one of the Trace ID items to open the Trace quick view. This view includes additional data such as Trace ID, group name, timestamp marking the beginning of a trace being monitored, and the originating service.
This detailed view of the operation includes their names and associated services, along with a visual representation of the time taken to complete a specific operation within a span. Use the search bar to highlight a specific operation or service you want to examine.
Collapse or expand spans at this depth by clicking the three dots on the left side of each operation. This can help focus on specific layers or components of your system by reducing visual clutter and making the trace data easier to analyze. You can also click the number to expand or collapse your view.
The link icon next to each operation and service opens the service overview for a deeper dive into the data. Click anywhere else inside the operation to open the quick view menu with additional details, including environment ID, span kind, and more.
YAML tab
You can view each node's YAML configuration, allowing easier troubleshooting and configuration verification.
Open the node you want to investigate and click the YAML tab. With direct access to YAML files, you can quickly understand and audit the underlying settings and setups of Kubernetes deployments, ensuring configurations align with operational requirements and best practices.
Investigate through quick view
See Metrics
You can easily investigate the different issues you might encounter.
Each quick view menu contains the View Metrics button, allowing you to view the relevant information in a Grafana application. This can provide a focused overview of the chosen element, allowing you to pinpoint what happened and when it started quickly.
See Logs
Node and pod views include the See Logs button, which opens an OpenSearch Dashboards screen with the relevant query to display the log information.
If you’ve manually set up your Kubernetes account, you might get an empty query with no results. In this case, you can view all related logs using a custom filter.
Click on Add filter at the top of the screen. The fields vary according to your chosen view; add k8s_node_name to the field to view Node related logs. To view Pod related logs, add k8s_pod_name to the field.
Next, choose the operator. For example, you can select exists to view all related logs.
Open Livetail
Node and pod views include the Open Livetail button, which opens Logz.io's Livetail filtered with the selected Kubernetes host. Live tail gives you a live view of your logs as they come into Logz.io, allowing you to view and troubleshoot in real time.
Open Traces
The Deployment view includes the See Traces button, which opens Jaeger with the relevant data needed to deep dive into it. Gain a system-wide view of your distributed architecture, detect failed or high latency requests, and quickly drill into end-to-end call sequences of selected requests of intercommunicating microservices.
Track Deployment Data
You can enrich your Kubernetes 360 graphs by adding an indication of recent deployments. This will help you determine whether a deployment has increased end-user response times, altered your application's memory/CPU footprint, or introduced any other performance-related changes.
To enable deployment tracking ability, run the Telemetry Collector on your Kubernetes clusters. You can also activate this process manually by installing Logz.io Kubernetes events Helm chart.
Once enabled, the graphs will include a deployment marker, marked by a dotted vertical line.
Clicking on the line allows you to view additional deployment data. This data includes the deployment time, the associated service and environment, and a quick link to view the commit in your logs.
Click Go to commit to access and view your own code related to this deployment, allowing you to probe deeper into the relevant data.
To activate the Go to Commit button, go to your app or service and add the following annotation to the metadata of each resource's versioning you want to track: logzio/commit_url: "", and the URL structure should be: "https://github.com/<account>/<repository>/commit/<commit-hash>". Learn more.

Additional information
Calculating Log error rate
To calculate percentage error, we take the percentage of errors in the last 15 minutes and the percentage of errors in the last 2 hours:
Errors in the last 15 minutes <= Amount of errors in the last 2 hours
For example, if in the last 15 minutes there were 10 log errors out of 200 total logs, it means that there's a total of 5% errors:
10/200 * 100 = 5%
And if in the last 2 hours there were 15 log errors out of 800 total logs, the percentage of errors will be 1.8%:
15/800 * 100 = 1.8%
So the log error rate you'll see will be 177.7%, based on the following formula:
(5/1.8 * 100) - 100 = 177.7%
Additional examples:
- Last 15 minutes = 5 error logs out of 50 total logs = 5/50 * 100 = 10%
- Last 2 hours = 6 error logs out of 800 total logs = 6/800 * 100 = 0.75%
- Error rate = (10/0.75 * 100) - 100 = 1233.3%
Or:
- Last 15 minutes = 2 error logs out of 100 total logs = 2/100 * 100 = 2%
- Last 2 hours = 2 error logs out of 800 total logs = 2/800 * 100 = 0.25%
- Error rate = (2/0.25 * 100) - 100 = 700%
Additional resources
- Read more about Logz.io's Kubernetes 360 platform.