Triggered Alerts
Creating alerts is half the job. The Status tab under Alerts is the other half: what actually fired, how severe it was, and what you're supposed to do about it.
Alerts has two tabs — Status for what has triggered, and Configurations for the alerts you've defined. This page covers Status; for Configurations see Understanding Alerts.
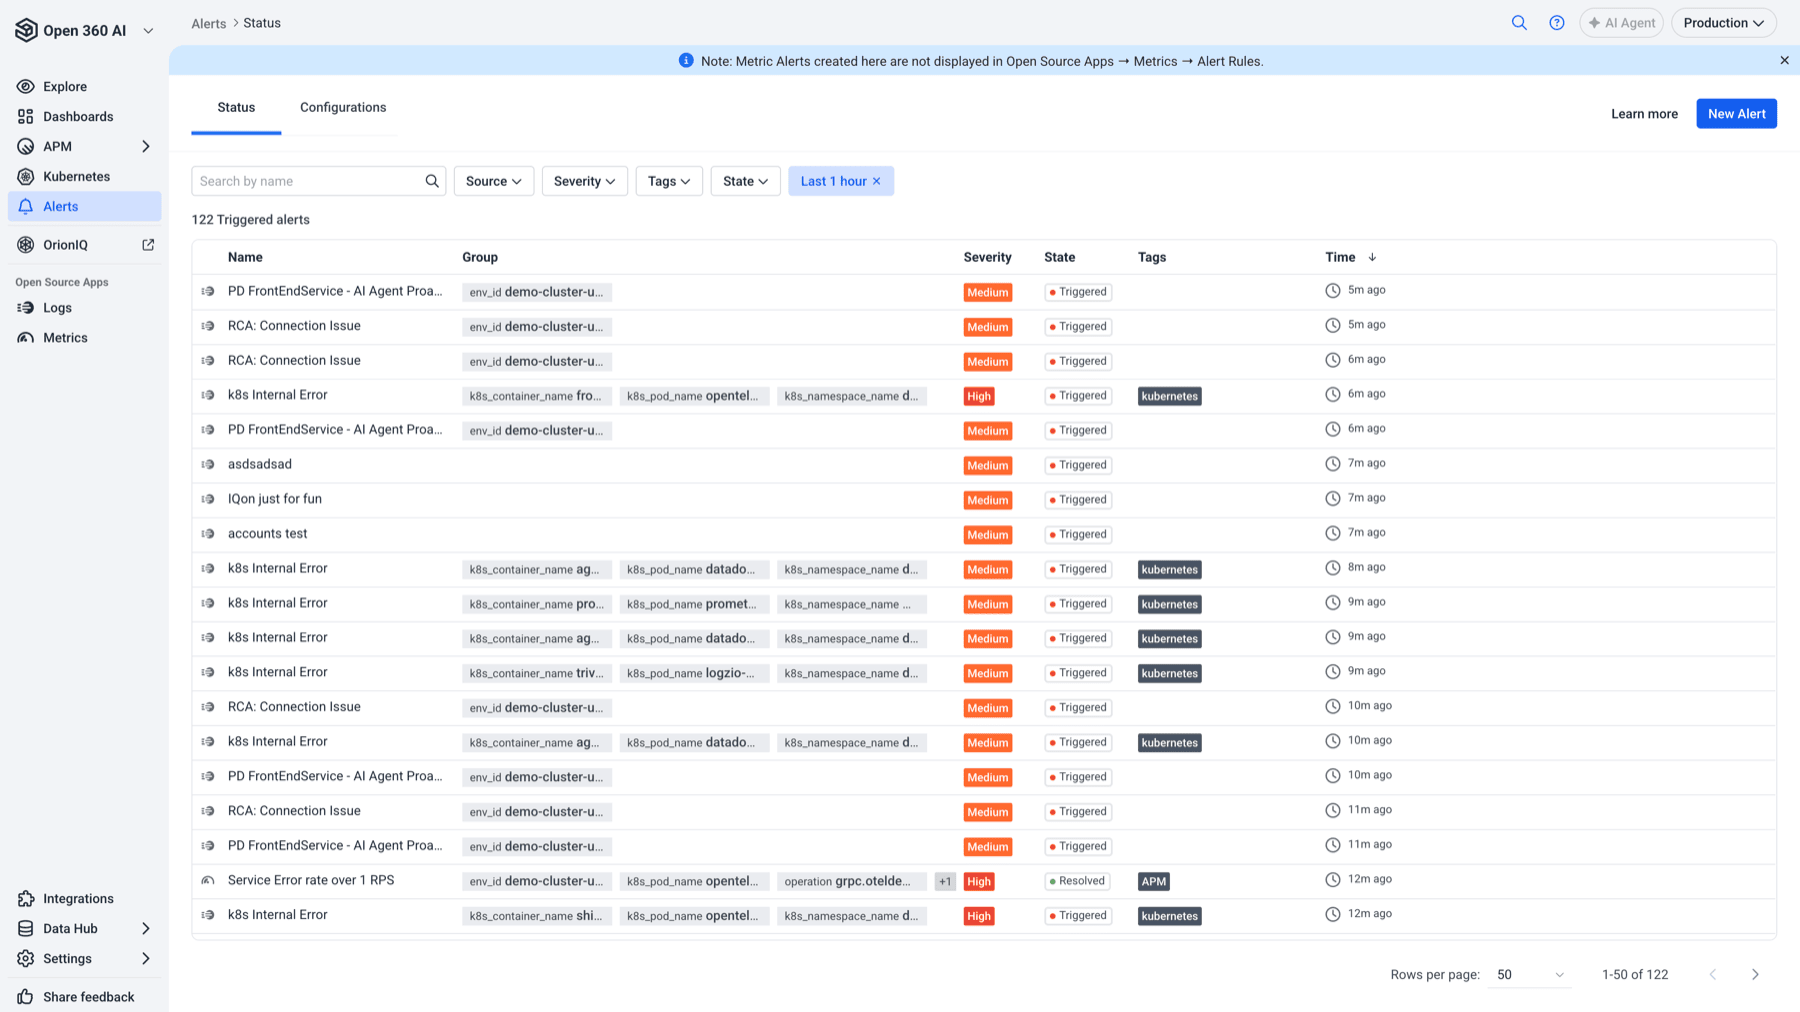
Read the list
| Column | What it tells you |
|---|---|
| Source icon | Whether the alert came from logs or metrics. |
| Name | The alert that fired. |
| Group | The group-by values this trigger is for, one chip per field — for example env_id, k8s_pod_name, k8s_namespace_name. Extra fields collapse into a +n chip. |
| Severity | Info, Low, Medium, High or Severe. |
| State | Triggered while the condition holds, Resolved once it clears. |
| Tags | The alert's tags, for filtering by team or system. |
| Time | How long ago it last triggered. |
The Group column is the one people overlook. An alert grouped by pod produces a separate trigger per pod, so the list tells you which pod is unhealthy without opening anything.
A count above the list shows how many triggered alerts match, and the list is paginated with a rows-per-page control — useful, because a noisy hour produces more rows than you'd expect.
Narrow the list
Alongside a Search by name box, you can filter by:
- Source — logs or metrics
- Severity
- Tags
- State — for example, only what's still Triggered rather than already Resolved
- Time range
Filtering by State to hide Resolved is usually the first thing worth doing during an incident, since it separates what's still broken from what already recovered.
Work a triggered alert
Selecting a triggered alert opens its detail, with the data that caused it and the context you need to act.
Row actions include View Instructions — the guidance whoever created the alert wrote for whoever receives it. If your alerts don't have instructions, that's the highest-value thing you can add to them; see Alert Instructions.
AI analysis
Where an alert has AI analysis enabled, the list shows its status and you can open the generated root-cause analysis alongside the trigger, rather than starting your investigation from scratch. See Configure an Alert for how to turn it on.