Explore in OpenSearch Dashboards
Explore in OpenSearch Dashboards are drilldown links that give you a direct shortcut from your Metrics' visualizations to the relevant logs in OpenSearch Dashboards.
A few dashboards provided out-of-the-box by Logz.io come with Explore in OpenSearch Dashboards drilldown links preconfigured. But generally speaking, these are very user-specific, so you'll want to set them up for yourself to suit your particular implementation.
Drilldown links help you go straight to the related logs whenever you identify an issue in your Metrics graphs and see a need to investigate it further. They are a powerful observability tool that gives you context and visibility into the logs that coincided with the Metrics events.
Add a panel with drilldown links
Before you begin, you'll need: Edit-permissions to the dashboard. If you don't, duplicate the dashboard first. It's also a good idea to have variables configured for your dashboard. Variables aren't required, but they are highly recommended.
Add a new panel
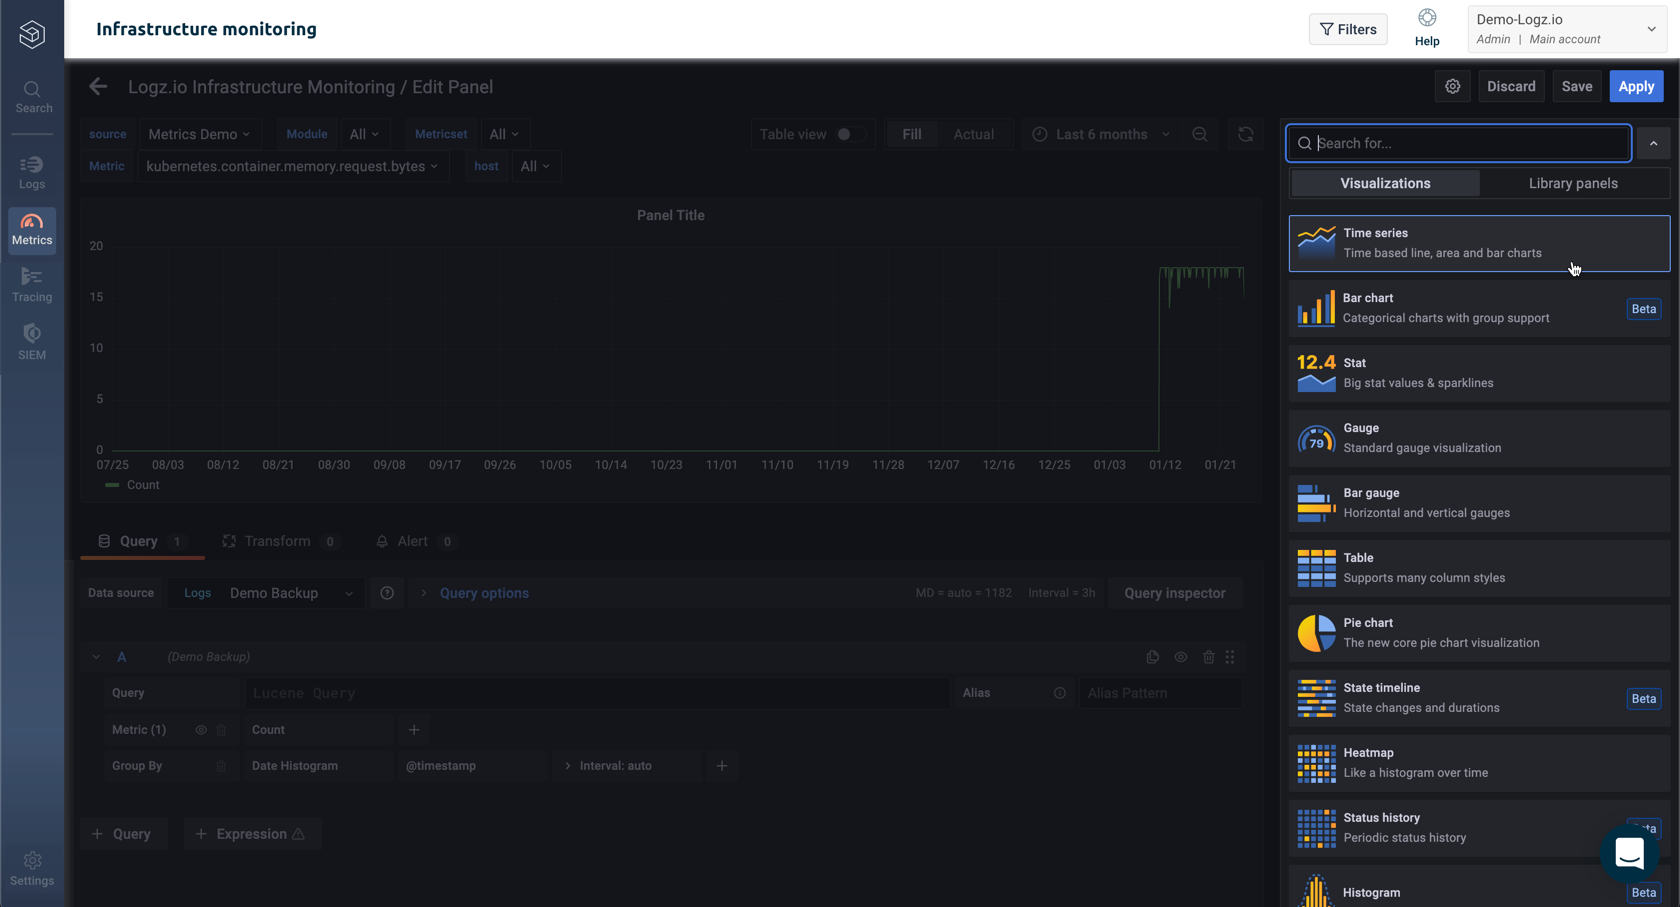
If you want to start fresh with a new dashboard, click in the left menu to add it. Otherwise, you can add a new panel: Click the Add panel button in the toolbar (in the upper right corner).
Click Add an empty panel.

Configure the panel
Select your Metrics account from the list of datasources.
Configure the Query.

Configure the visualization
Click the Time series title on the right to see all visualization options.
If you plan to add alerts to the visualization, note that only Time series is supported. (This is a Grafana limitation.)
Configure the drilldown link
Go to Panel options located at the right side of the screen, and click the Panel links section. Click + Add link.

Set the Title to Explore in OpenSearch Dashboards, unless you want to name it something else.
Copy this endpoint to the URL:
/#/explore-kibana-from-grafana?$__url_time_range&query=Write your OpenSearch Dashboards query in Lucene syntax. Make sure there are no spaces before and after the
=operator.It is a good idea to test your query in OpenSearch Dashboards to make sure you're getting the intended results.
Query syntax and tips
If you're using variables in your query, note that there is a slight syntax difference depending on whether you've enabled multi-select or not.
To check your variable settings or change them, navigate to Dashboard settings > Variables.

- If Multi-value or Include All option are toggled on, write the variable name as usual - for example
$node. - If they are toggled off, write the variable name between double quotes - for example
“$node”.
Suppose you have a Node variable filtered on a specific node. If you wish to look for Kubernetes logs related to the specific node your dashboard is currently filtered on, your URL might look like this:
/#/explore-kibana-from-grafana?$__url_time_range&query=kubernetes AND $node
If the node variable doesn't have either Multi-value or Include All option on, you'll write the variable between double quotes. This way you don't specify a particular value selection:
/#/explore-kibana-from-grafana?$__url_time_range&query=kubernetes AND “$node”
Save and test
Save your dashboard. (The Save dashboard button is in the toolbar in the upper right corner.)
Test your new drilldown link by hovering over (upper left corner of the panel), and clicking Explore in OpenSearch Dashboards.
