Trace Timeline
What can I do in the Trace Timeline?
Start here and dig in:

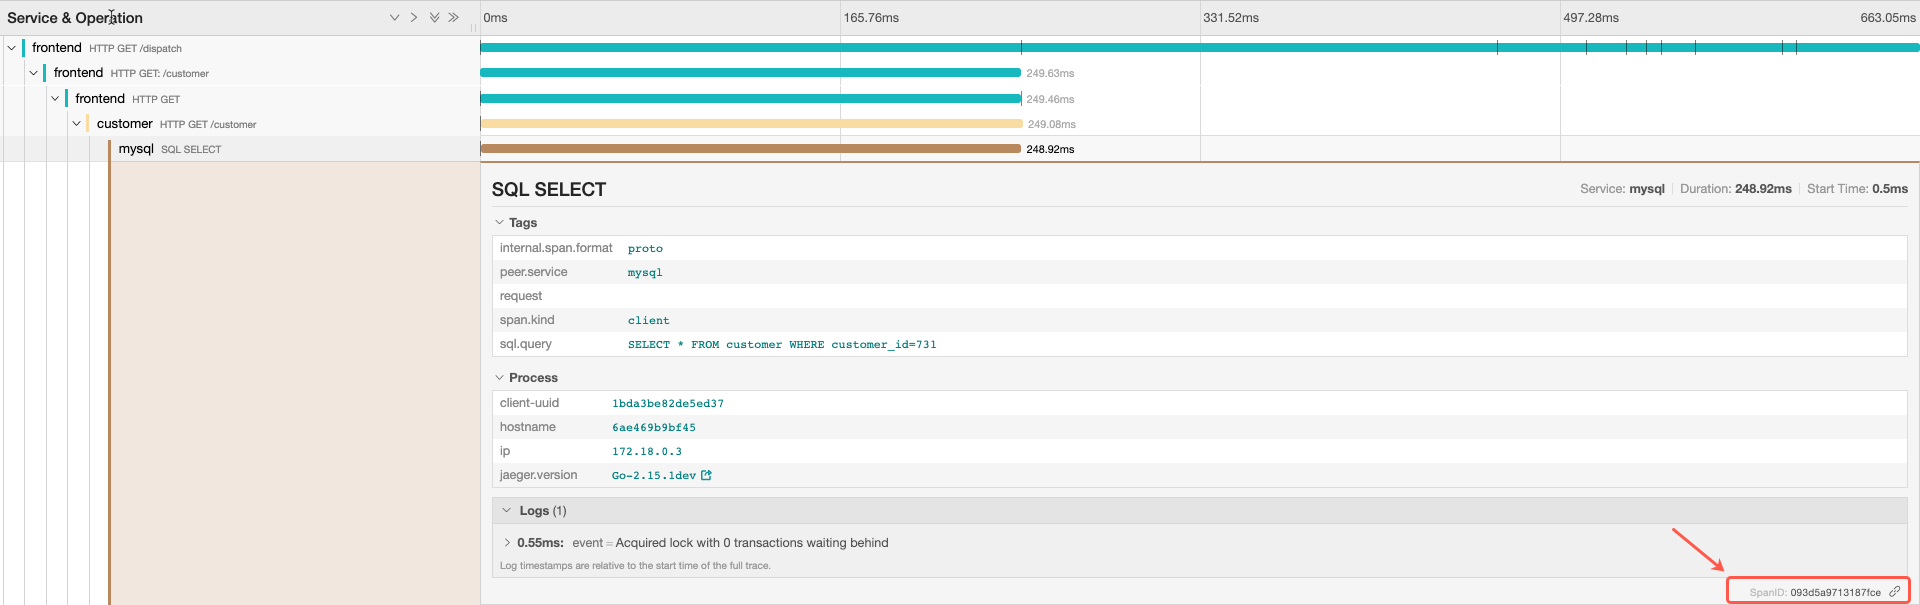
In the timeline, each horizontal bar is a span with a unique ID. The services are color-coded to help you identify and track the services involved. The duration of each span is indicated and the relative duration is represented by the length of the span’s horizontal bar. A red error icon in the Services & Operations tree indicates that the span was tagged as an error.
- View the spans included in the space, color-coded by service, nested by operation.
- Expand and collapse the spans within the trace.
- Click a span to view its details, including tags and process information.
Spans also include tags and multiple logs, depending on how you set up your instrumentation. The tags and process sections indicate span context. In the example below, the SQL span attached the SQL query to the span’s tags. The spanID is located in the lower right corner.
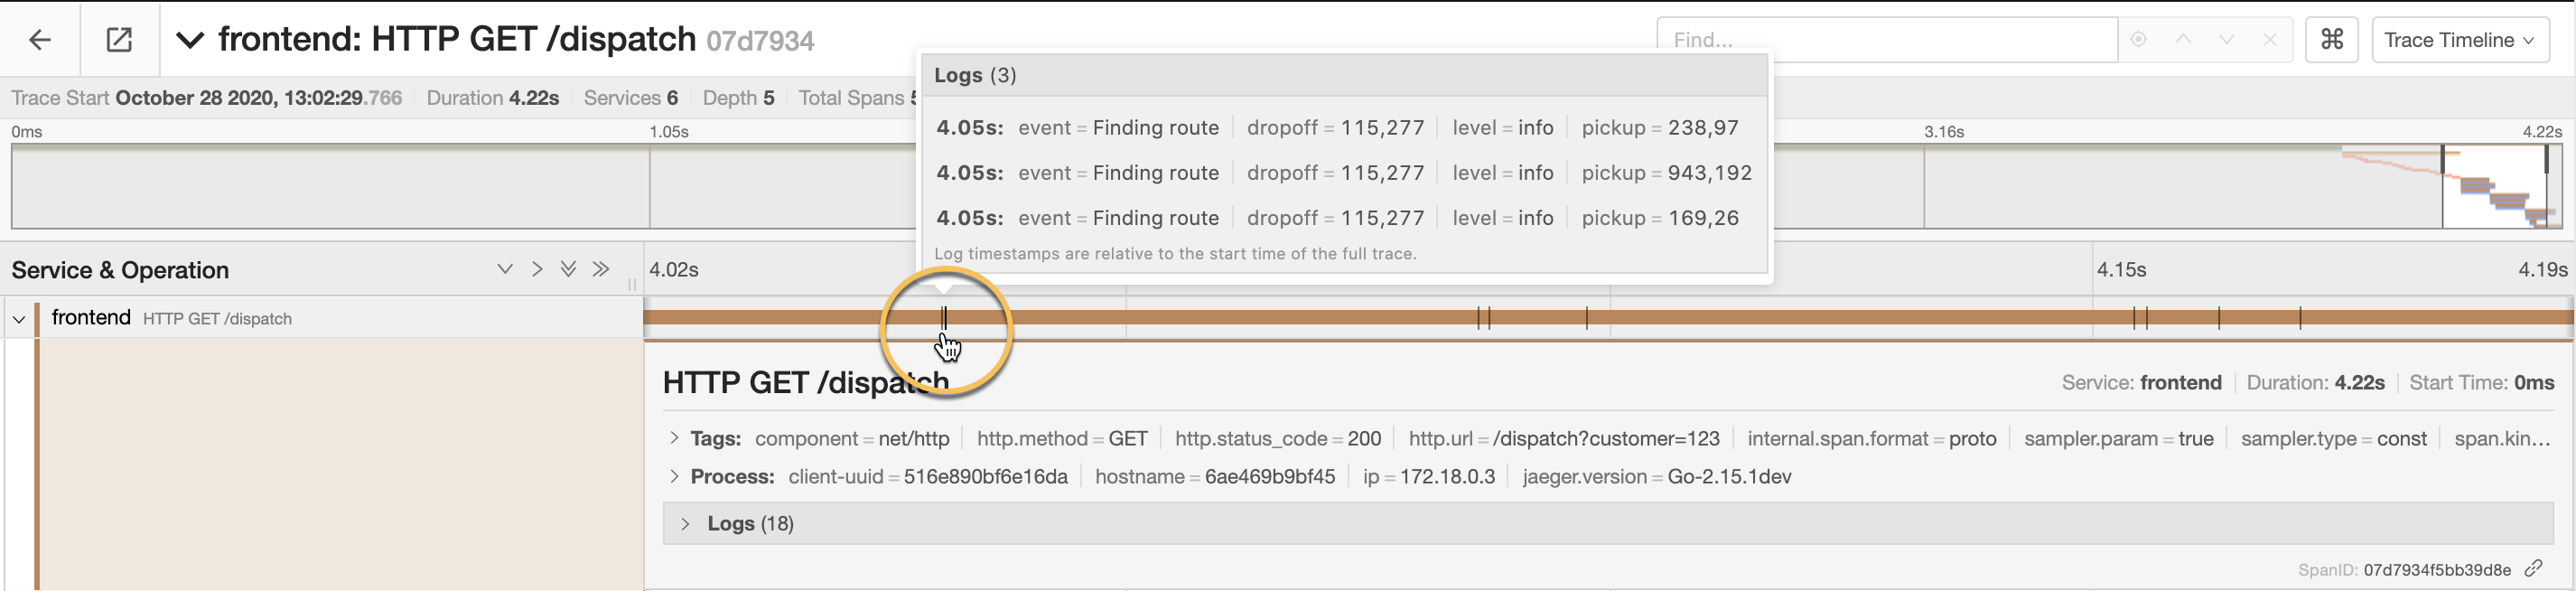
Use the hairlines at the top of the page to focus on specific time segments during the trace.

Click a log marker to see the log details for a specific time.
Expand and Collapse the spans in the Service & Operation list and change the size of the span area.

Troubleshooting with the Trace Timeline
The trace timeline can help you find patterns that might indicate potential issues with the system flow.
Patterns to look out for:
Large time gaps between spans may indicate instrumentation gaps.

A sequence of spans that looks like a staircase may indicate an opportunity for performance improvement by increasing parallelism for the relevant microservices.

When all the spans end at the same time, there may be a connectivity issue that is causing timeouts or errors.
