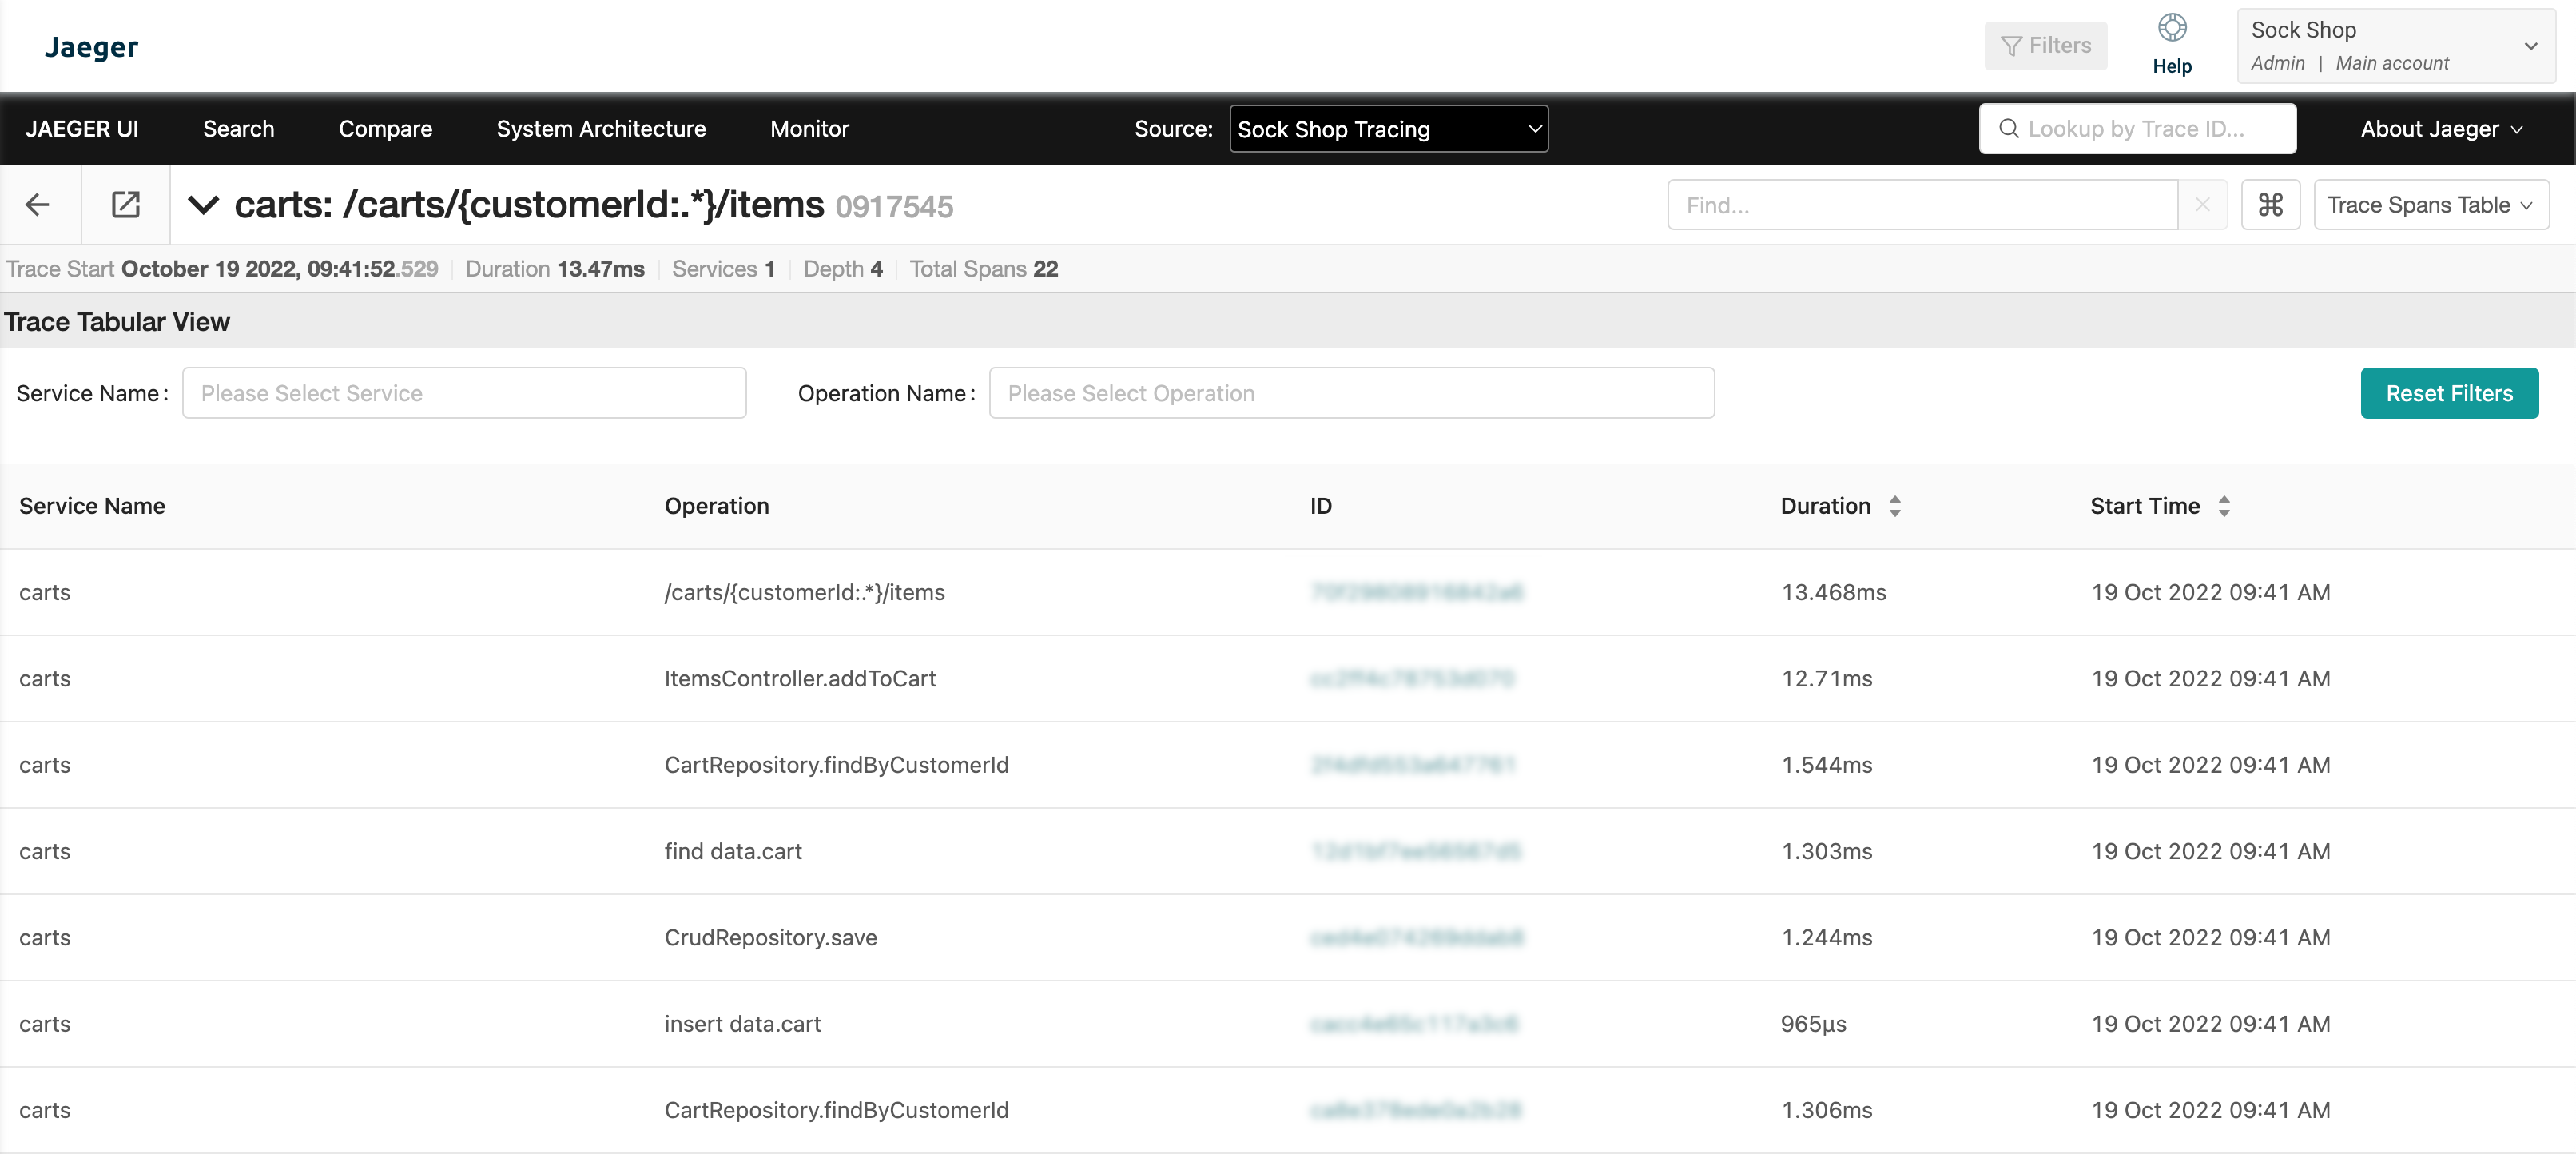
Spans Table
The Spans Table provides a table view of your services and operations. It’s a textual representation of what’s happening inside your trace, and you can filter your view based on a specific service or operation.
Use this view to identify high latencies in services.
The table includes the following columns:
- Service name
- Operation in which it executed
- The Trace's ID
- The service's running duration
- Each service's start time and date
In addition, you can filter your view by clicking on the Duration or Start Time columns.