Home Dashboard
Logz.io Home Dashboard provides an overview of your environments, including the overall usage of your logs, metrics, and traces, the number of alerts triggered, exceptions found, and insights gathered within the chosen time frame.
With Home Dashboard, you can quickly assess the current status of your system and identify which areas require your attention, making it easier to gain observability and manage your system’s health effectively.
Dashboard overview
Home Dashboard includes your account’s data, logs, metrics, traces, alerts, exceptions, and insights.
You can quickly access the Home Dashboard by clicking on the Home icon in the navigation.

1. Choose elements to view
You can choose which elements you want to view; logs, metrics, traces, number of alerts triggered, and insights gathered within the selected time frame. Click on one of the boxes to add or remove them from your view. The graph and chart will be updated immediately.
For example, clicking on Insights or Exceptions will remove all of them from the graph and the table, allowing you to shift your focus according to your monitoring needs.

2. Graph view
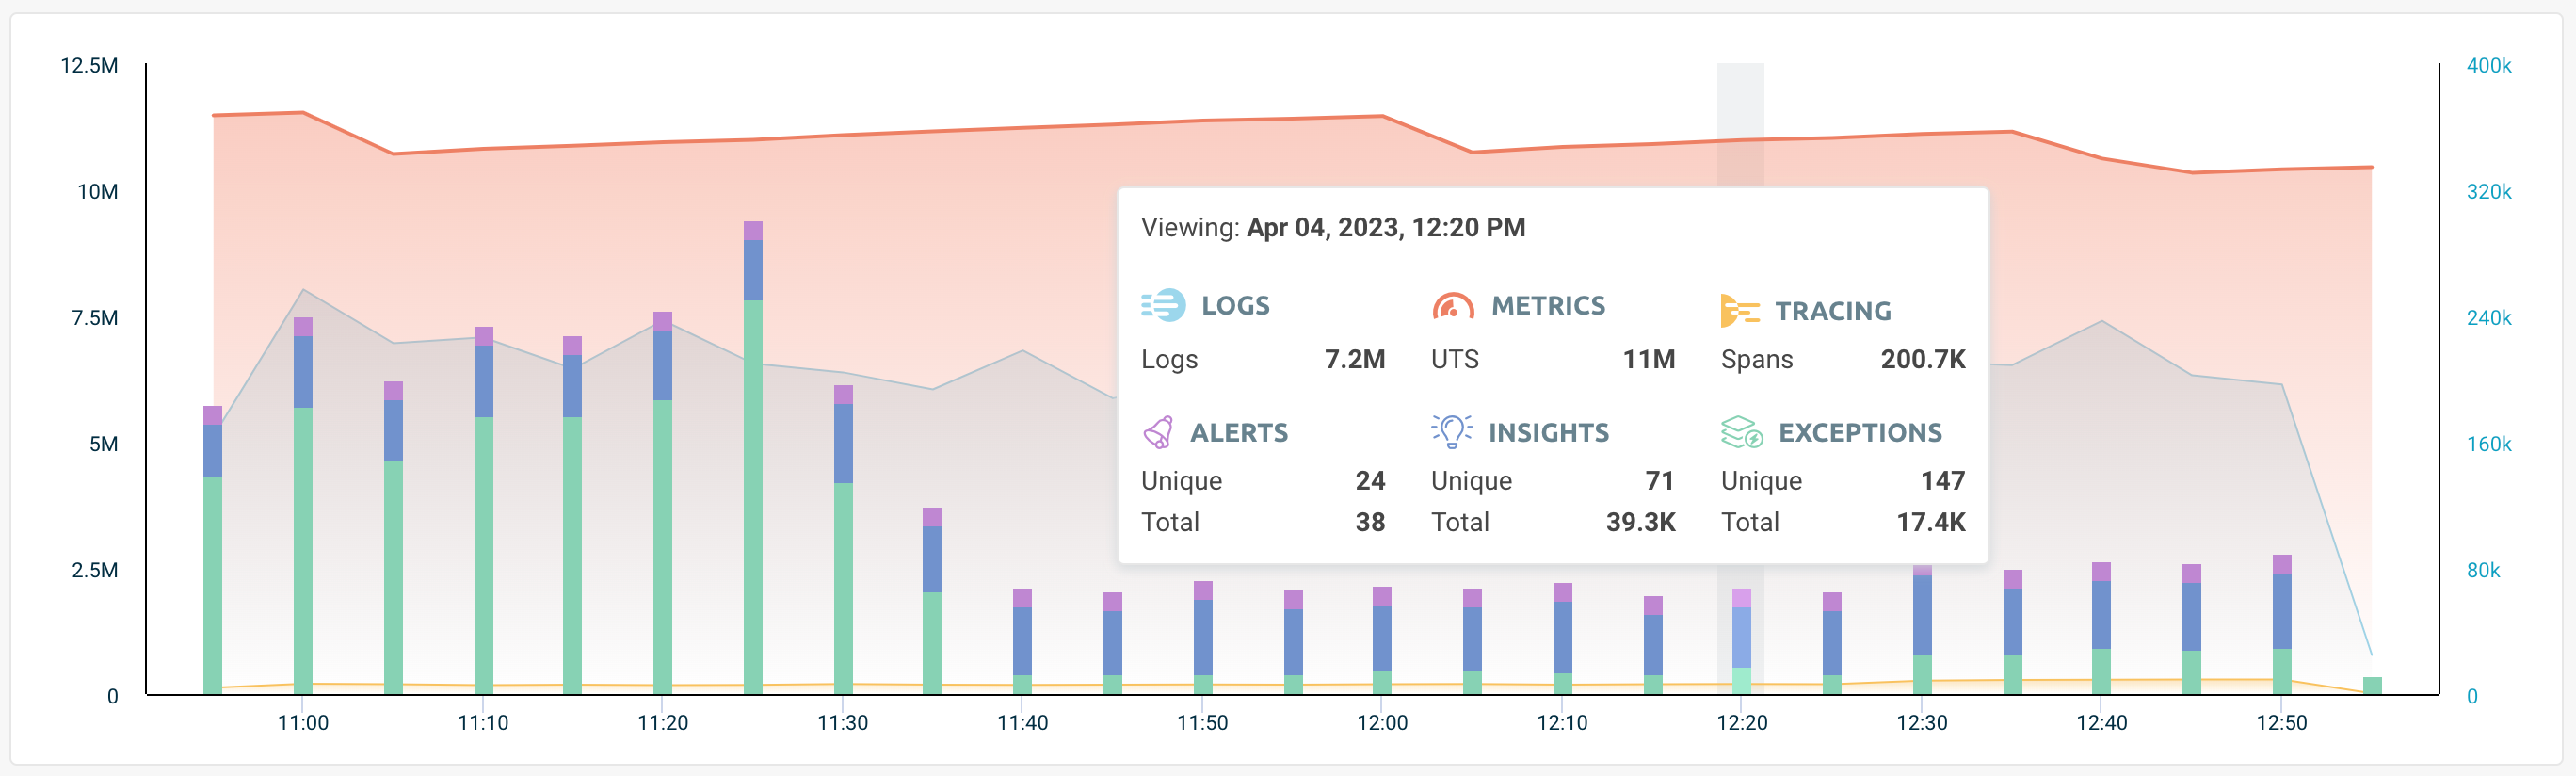
This is a visual representation of your account’s data. Hover over the graph to see a breakdown of elements per hour. This view includes the number of overall and unique events.
3. Table view
At the bottom of the page, you can view your account's data as a table. The data is broken down by events, and you can view each event’s type, severity, number of grouped events, and the date on which the event was last triggered.
When hovering over one of the events you'll see an Investigate button, which opens it in OpenSearch Dashboards, allowing you to drill down further into the issue.

4. Search and access dashboards
Home Dashboard offers easy access to your logs and metrics dashboards, allowing you to search any available dashboard across your account. Start typing to search throughout your available dashboards, and click on one of the options to open it in a new tab. This view includes which dashboards you've viewed recently, and you can add critical or important dashboards to your favorites for quick access.
5. Time frame
The top of the page indicates when the data was last updated, helping you keep up to date with the data.
You can change the time range to view data from the last 24 hours and up until from the last 2 hours. Once you choose a different time frame, Home Dashboard will update to reflect the relevant data.