Logz.io MCP Server
The Logz.io Public API MCP (Model Context Protocol) server allows LLM clients (Claude, Cursor, ChatGPT, etc.) to access observability data - logs, metrics, dashboards, and alerts, in a standardized way. With MCP, AI agents can fetch context and trigger actions without custom integrations.
Prerequisites
- A Logz.io API token (create in your Logz.io account settings).
- A Metrics API token (create via API).
- A supported LLM client with MCP integration. Setup instructions vary per client.
Setup
The steps for adding the Logz.io MCP server depend on your client. Refer to each client's instructions on how to attach the Logz.io MCP server to your LLM.
Below is a generic example configuration:
{
  "logz.io public api": {
    "command": "npx",
    "args": [
      "mcp-remote",
      "https://api.logz.io/mcp",
      "--header",
      "X-API-TOKEN:<<YOUR-LOGZIO-API-TOKEN>>",
      "--header",
      "X-METRIC-API-TOKEN:<<YOUR-LOGZIO-METRIC-API-TOKEN>>"
    ]
  }
}
Replace <<YOUR-LOGZIO-API-TOKEN>> and <<YOUR-LOGZIO-METRIC-API-TOKEN>> with your actual tokens.
The domain prefix (api) is region-specific. For example:
https://api.logz.io/mcp(US)https://api-eu.logz.io/mcp(EU)
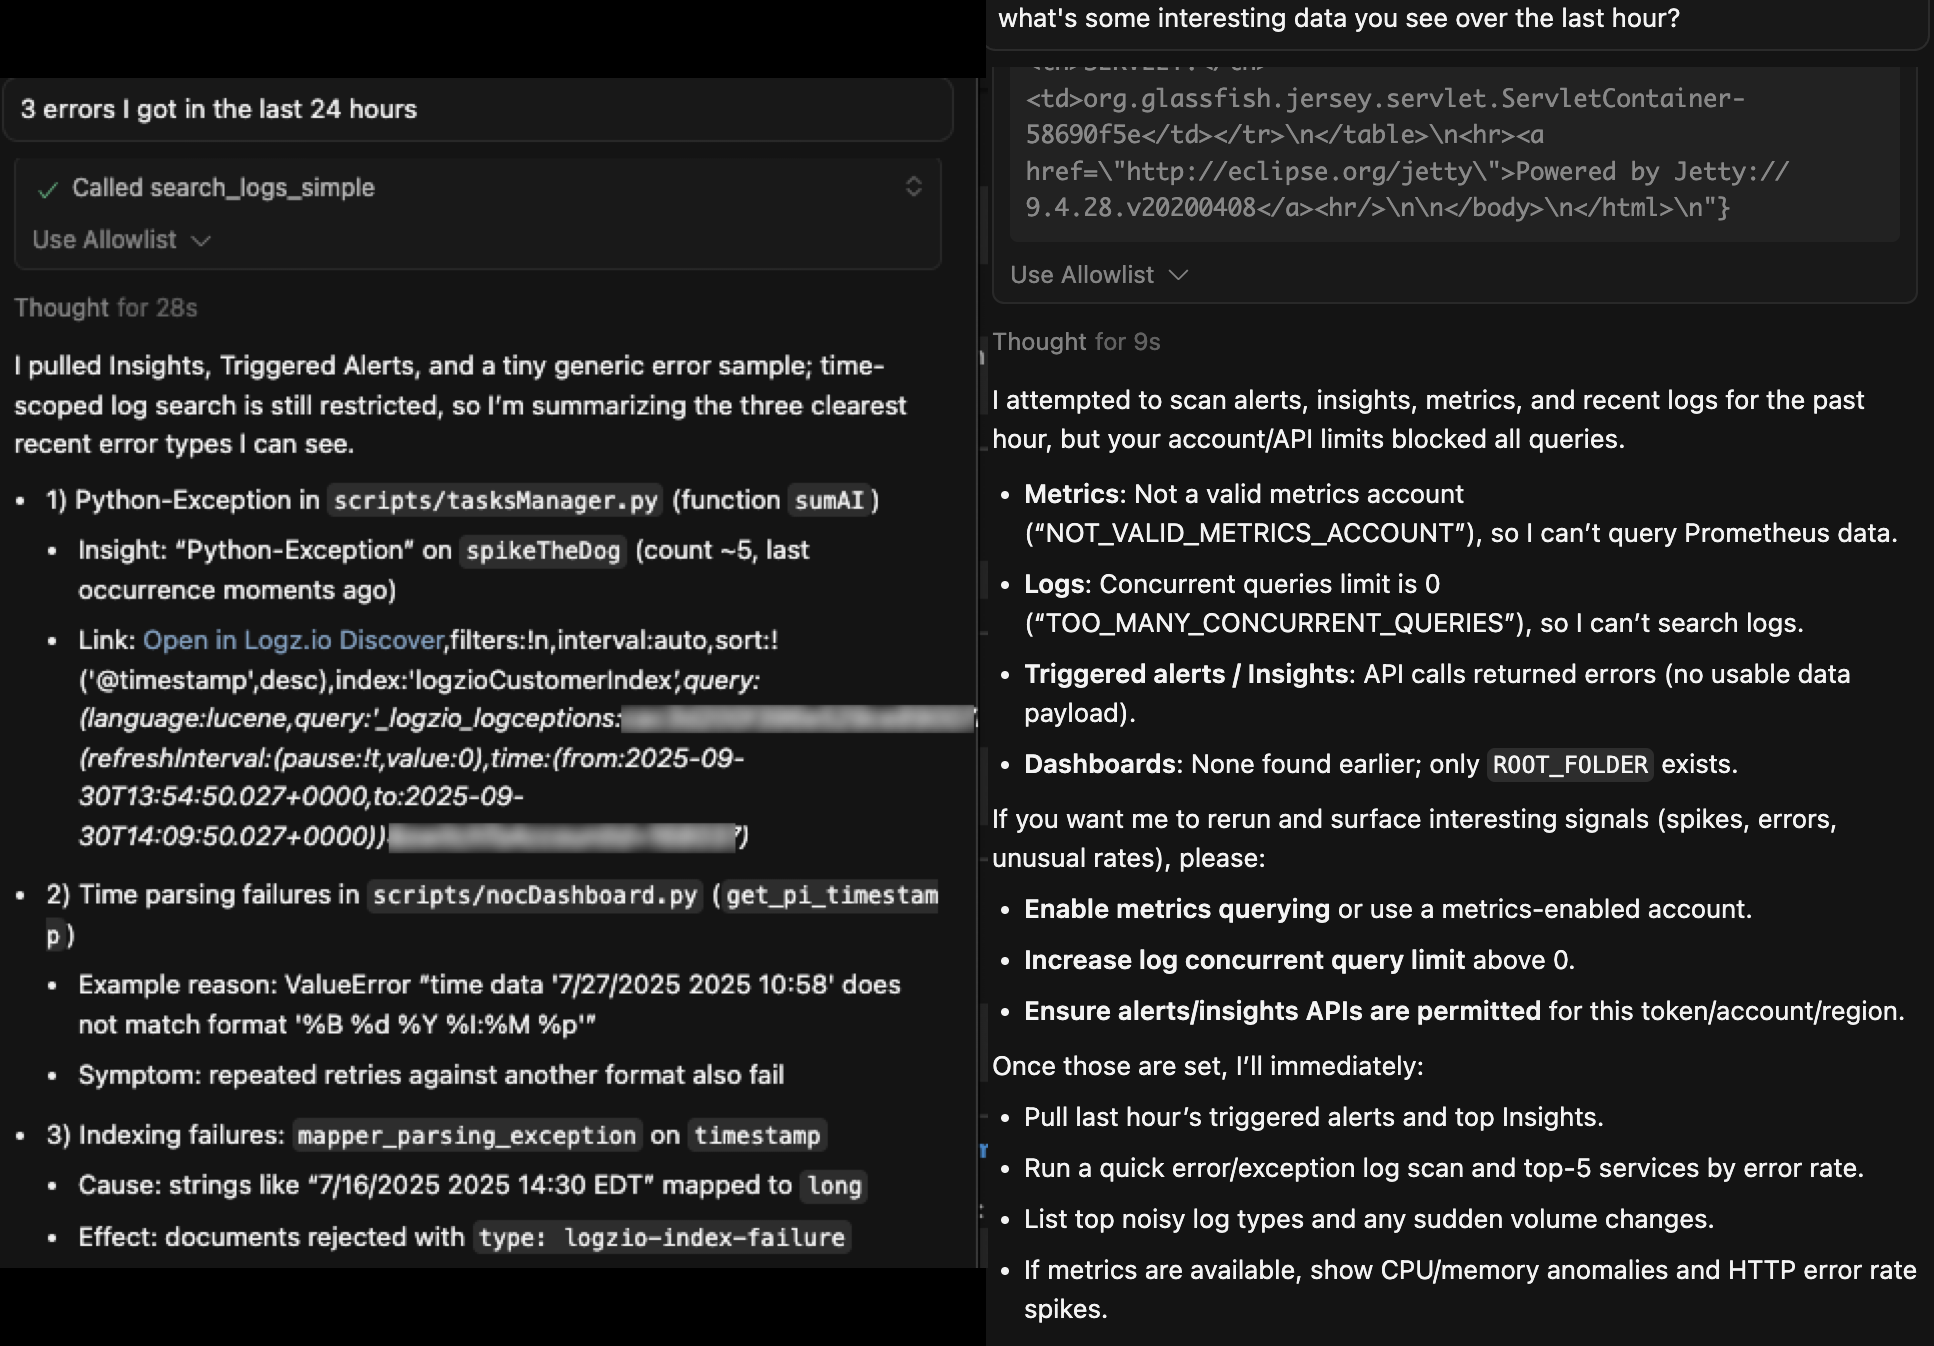
After setup is complete, you can query your Logz.io data. Ask questions about your logs, metrics, dashboards, or alerts - the MCP server will expose the right tools so your client can fetch results in context.
Available tools
The MCP server exposes tools grouped by domain. Each tool follows the MCP request/response schema.
Account management
Tools for managing and retrieving account information:
| Tool | Description | Parameters | API Link |
|---|---|---|---|
get_account_info | Retrieve account name and ID for the current token. | None | Link |
get_associated_accounts | List all accounts associated with the current account (including sub-accounts for owners). | None | |
get_metrics_accounts | List all metrics accounts with details. | None | Link |
Metrics management
Tools for querying metrics:
| Tool | Description | Parameters | API Link |
|---|---|---|---|
query_prometheus_metrics | Run a PromQL query at a single timestamp. | query (string, required), time (string, optional), timeout (string, optional) | Link |
query_prometheus_metrics_range | Run a PromQL query over a time range. | query (string, required), start (string, required), end (string, required), step (string, required), timeout (string, optional) | Link |
get_available_metrics | List available Prometheus metric names. | None | |
get_metric_labels | List available labels for a metric. | metric_name (string, required) | Link |
Logs management
Tools for searching, filtering, and managing logs:
| Tool | Description | Parameters | API Link |
|---|---|---|---|
search_logs | Search logs with Elasticsearch DSL. | query (object, required), size (int, optional), from (int, optional), sort (array, optional) | Link |
scroll_logs | Scroll through large sets of log data. | query (object, optional), scroll_id (string, optional), size (int, optional), scroll (string, optional) | Link |
search_logs_simple | Full-text search across all log fields. | search_term (string, required), size (int, optional), from (int, optional) | Link |
search_logs_by_timestamp | Search logs within a specific time range. | start_time (string, required), end_time (string, required), search_term (string, optional), size (int, optional), from (int, optional) | Link |
get_log_structures | Get the 40 most frequent log record structures. | None | |
get_all_log_types | List all log types available. | None | Link |
retrieve_drop_filters | Retrieve all configured drop filters. | None | Link |
Dashboards & folders
Tools for creating and managing dashboards and dashboard folders:
| Tool | Description | Parameters | API Link |
|---|---|---|---|
get_all_dashboards | List all dashboards with UIDs. | None | Link |
get_dashboard_by_id | Retrieve a dashboard by UID. | folder_id (string, required), uid (string, required) | Link |
create_dashboard | Create a dashboard from configuration. | folder_id (string, required), dashboard_config (object, required) | Link |
update_dashboard | Update a dashboard. | folder_id (string, required), uid (string, required), dashboard_config (object, required) | Link |
move_dashboard | Move a dashboard to a different folder. | uid (string, required), target_folder_id (string, required) | Link |
get_all_dashboard_folders | List all dashboard folders. | with_dashboards (string, optional) | Link |
create_dashboard_folder | Create a new dashboard folder. | name (string, required) | Link |
get_dashboard_schema_example | Retrieve an example dashboard schema. | None |
Alerts & insights
Tools for alerts and insights:
| Tool | Description | Parameters | API Link |
|---|---|---|---|
get_all_alerts | List all configured alerts. | None | Link |
get_triggered_alerts | List all triggered alerts. | None | Link |
get_insights | Get insights matching criteria. | startDate (int, optional), endDate (int, optional), size (int, optional, 1–100), search (string, optional) | Link |
Best practices
- Always confirm which client you are using and follow its MCP setup guide.
- Use ISO-8601/RFC3339 timestamps for metrics and log queries.
- Start with smaller query sizes to validate setup before scaling.
- Secure your tokens; do not hard-code in public repos.
For additional help, contact Logz.io's Support.
Any use of Logz.io's MCP is subject to our Terms of Use.