Integrations Dashboards
Integrations Dashboards are currently in beta and available only in Open 360 AI. To enable access, contact Support or your account manager.
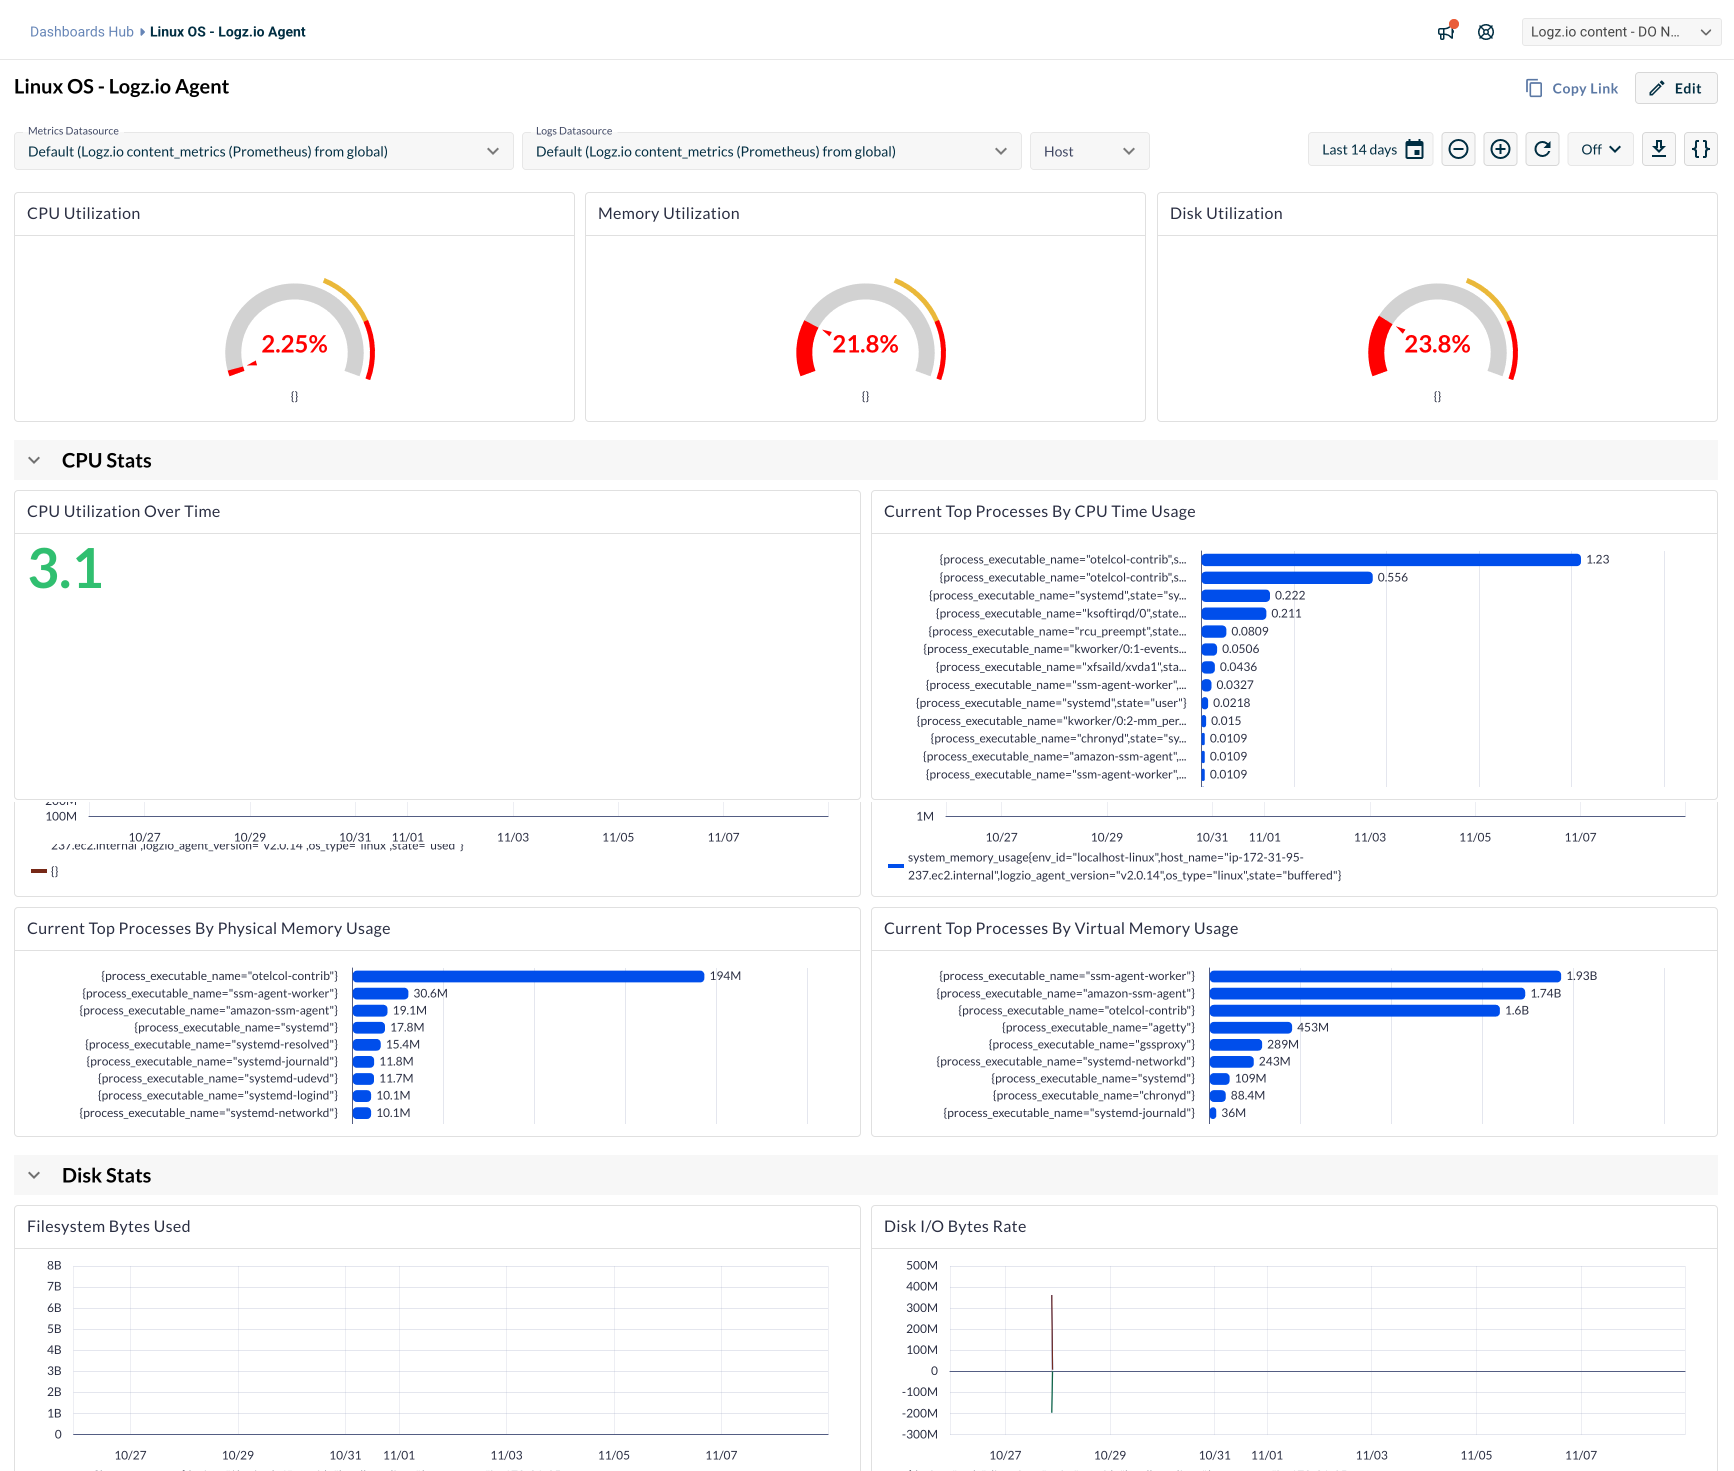
Integrations Dashboards are prebuilt, Logz.io-provided dashboards for your integrations. They give immediate visibility into key metrics, performance, and error trends - no manual setup required. Use them as-is to monitor your environment, or duplicate a dashboard to edit and adapt it to your needs.
Find & filter
Open Dashboards and expand the Integrations Dashboards folder.
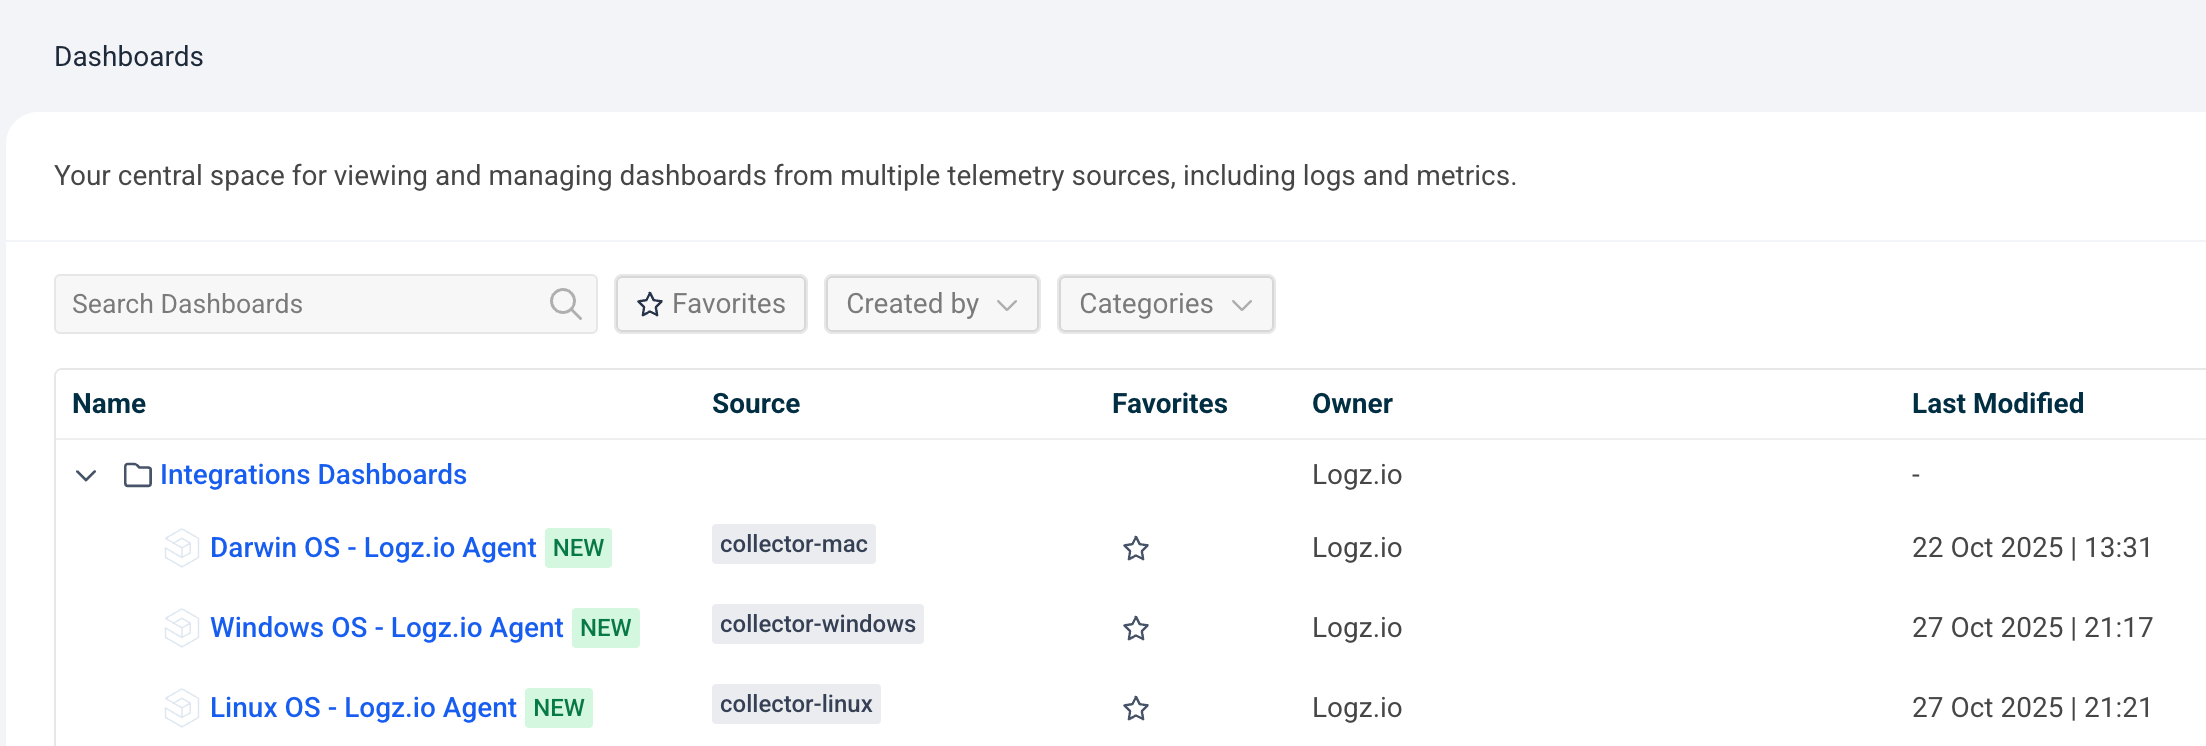
The list shows all dashboards provisioned from your installed integrations.
Use the Categories filter to switch views between your custom dashboards and ones created by Logz.io.
Once you send data with a supported integration, Logz.io automatically provisions one or more dashboards associated with that integration.
Use dashboards
Logz.io dashboards are intentionally read only to preserve a reliable baseline and prevent accidental edits.
To create an editable copy:
- From the Dashboards hub or from within a dashboard, select Duplicate.
- In the modal, enter a name and choose a destination folder.
- Create the dashboard, then open the copy to edit panels, change filters, move folders, and more.
Supported integrations
The following list includes available integrations and their dashboards:
| Integration | Dashboard |
|---|---|
| AKS | Kubernetes Cluster Summary |
| AKS | Kubernetes Pods |
| Apache Cassandra | Apache Cassandra |
| Apache Tomcat | Apache Tomcat |
| Apache Web Server | Apache Web Server |
| AWS CloudWatch | API Gateway - via Metrics Stream Integration |
| AWS CloudWatch | DynamoDB - via Metrics Stream Integration |
| AWS CloudWatch | EBS - via Metrics Stream Integration |
| AWS CloudWatch | EC2 - via Metrics Stream Integration |
| AWS CloudWatch | ECS - via Metrics Stream Integration |
| AWS CloudWatch | EFS - via Metrics Stream Integration |
| AWS CloudWatch | Kafka - via Metrics Stream Integration |
| AWS CloudWatch | S3 - via Metrics Stream Integration |
| AWS CloudWatch | SNS - via Metrics Stream Integration |
| AWS CloudWatch | SQS - via Metrics Stream Integration |
| AWS EC2 | AWS EC2 |
| AWS EC2 | Linux OS - Logz.io Agent |
| AWS EC2 | Windows OS - Logz.io Agent |
| AWS CloudWatch | Classic ELB |
| AWS CloudWatch | Classic ELB 7.6+ |
| Darwin OS | Logz.io Agent |
| Docker | Docker Containers Overview |
| GCP | Cloud Functions |
| GCP | Compute Engine |
| Kubernetes 360 | K8s 360 - Cluster Stats |
| Kubernetes 360 | K8s 360 - DaemonSet Stats |
| Kubernetes 360 | K8s 360 - Deployment Stats |
| Kubernetes 360 | K8s 360 - Job & CronJob Stats |
| Kubernetes 360 | K8s 360 - Node Stats |
| Kubernetes 360 | K8s 360 - Pod Stats |
| Kubernetes 360 | K8s 360 - ReplicaSet Stats |
| Kubernetes 360 | K8s 360 - StatefulSet Stats |
| Linux OS | Logz.io Agent |
| MySQL | MySQL |
Troubleshooting
I don’t see the Integrations Dashboards folder
This feature is in beta. Confirm it’s enabled for your account (contact Support or your account manager), verify that at least one supported integration is installed, then refresh the Dashboards hub.
I cannot edit a system dashboard
This is expected. Use Duplicate to create an editable copy.
I duplicated a dashboard but don’t see it
You can search for a dashboard by name or filter by Categories.
FAQ
What is the difference between system dashboards and custom dashboards?
System dashboards are provided by Logz.io and are read‑only. Custom dashboards are user‑owned and fully editable.
Why are system dashboards read‑only?
To preserve a clean, reliable baseline that can be referenced or cloned without risk of accidental changes.
Can I rename the Integrations Dashboards folder?
No. The folder name is fixed to help users quickly find out‑of‑the‑box content.
Will dashboards be added automatically for new integrations?
Yes, when a newly‑installed integration includes system dashboards, they will be provisioned automatically.